Best stocks to trade on February 3-7
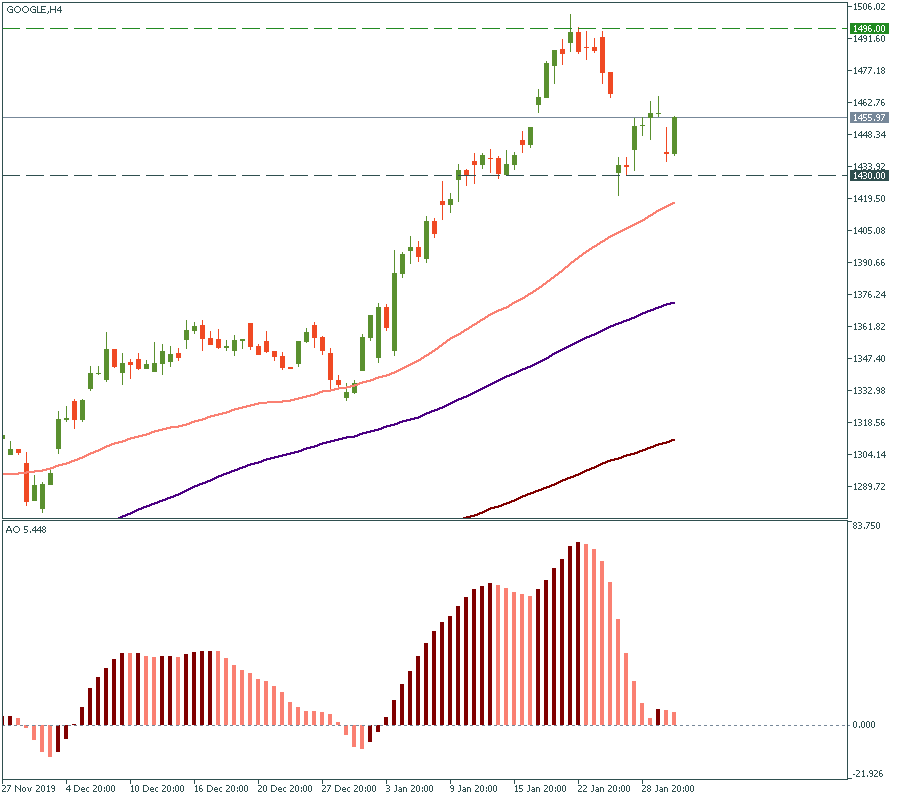
Google: a healthy outlook
From a technical perspective, Google stock looks healthy. The Moving Averages are in ascending order, the price is mostly moving above the 50-MA. Currently, it is at $1,456 per share. The earnings report coming on Monday at midnight will either push it up to $1,496 or drag it down to the support of $1,430. Graphically, the last several months have been showing the following pattern: three-four weeks of rising and moving above the 50-MA get interrupted by several days of dipping below. That’s also visible at the corresponding Awesome Oscillator movement: each time a dip below the zero-line is followed by a “mountain” of several weeks. This observation does apply to mostly each month since September 2019. If the picture does not change, the next week should bring us another slight decline in the stock price, but then it is “supposed” to rise back again and keep doing so for two-three weeks.
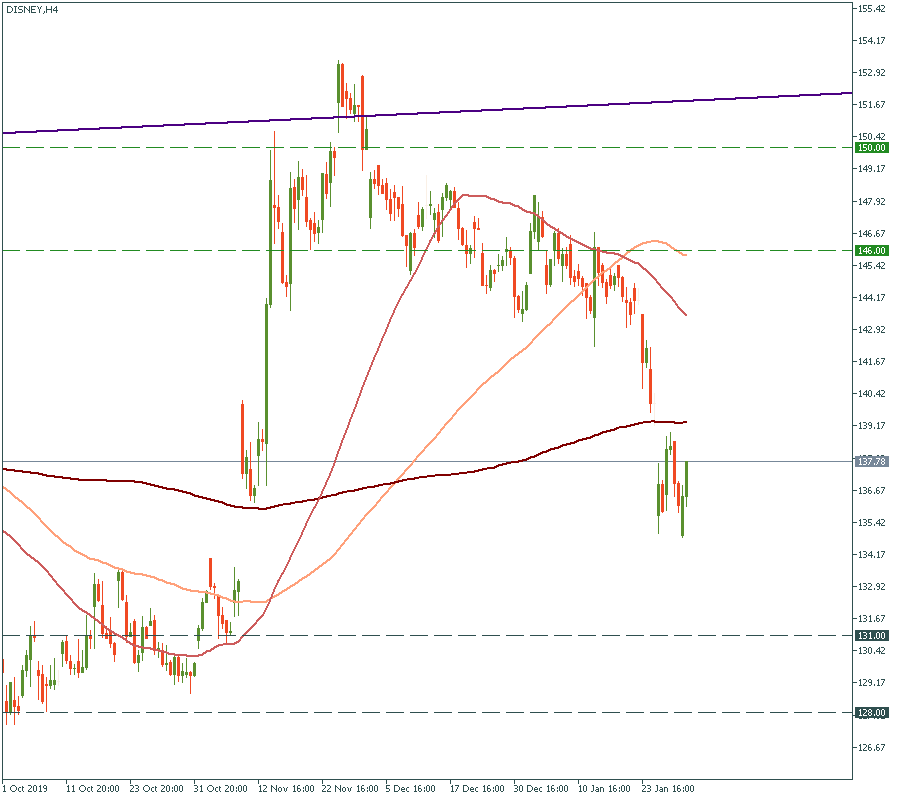
Disney: flood myth
After the gym-style healthy chart of Google, the performance of Disney stock price looks like the flood myth representation. The 50-MA crossed the 100-MA recently, both aiming downwards. Although that does not qualify as a “death cross”, the 200-MA is not very far away down. In any case, the price has been dropping since December and is likely to keep doing that in the mid-term, unless Disney shows some good sales results in Tuesday’s earnings report.
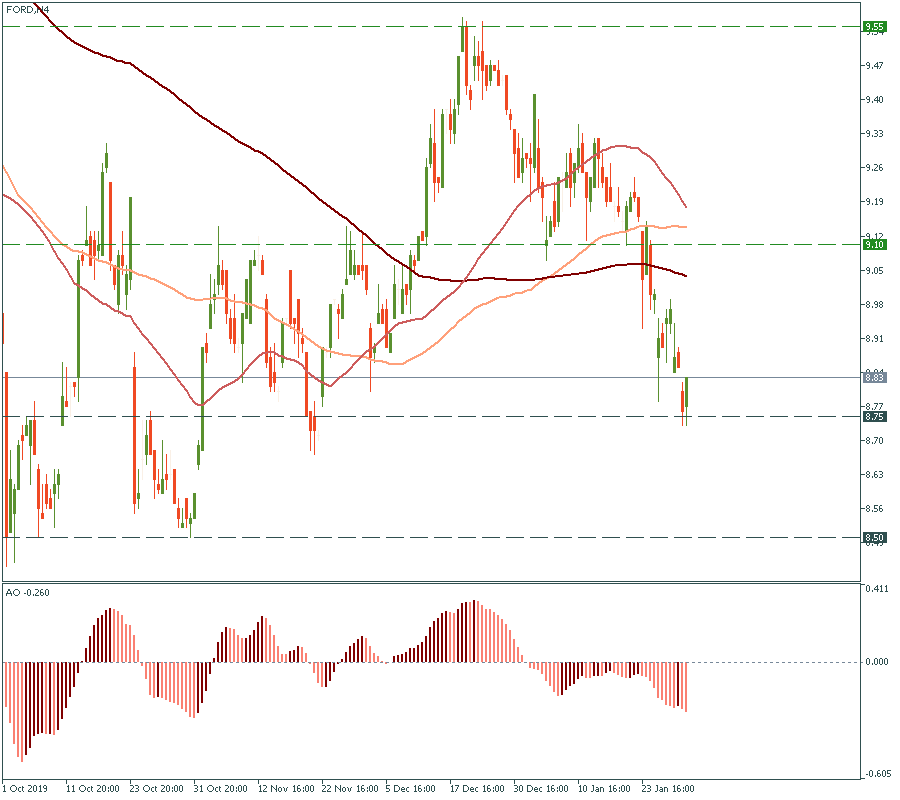
Ford: descendence
In here, there are problems. The inverted configuration of the Moving Averages and the declining-to-flat shape of the 200-MA tell us that this stock has been experiencing some hard times long already. There is little reason to expect it to take a different direction in the nearest future, unless Ford surprises us with some outstanding performance in the earnings report on Tuesday. If it does, the price will have to get back to the resistance of $9.10 left not so long ago. Otherwise, it is already testing the support of $8.75. From there, the 10-months low of $8.50 is not so far away.
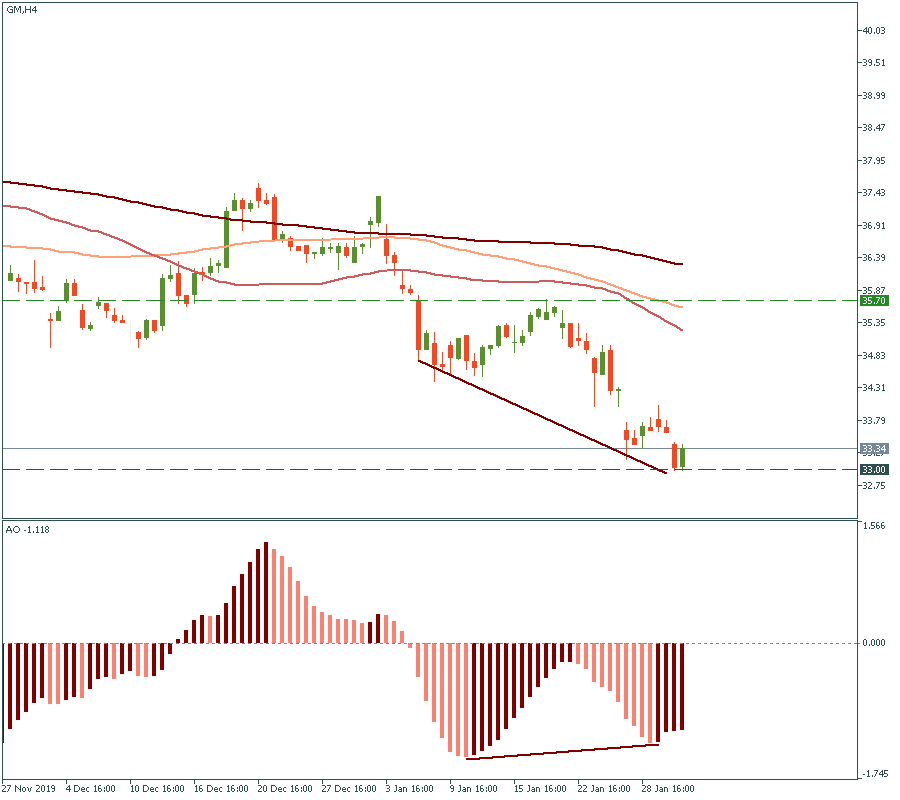
General Motors: just on time
General Motors does also look heavy, but there are a few technicalities that make it look more optimistic than Ford. First, the movement of the stock price looks smoother. The Moving Averages are more aligned to each other, although all of them are in the descending order. That means the performance of this share is not so dramatically volatile and stochastic like Ford. Also, the regular bullish divergence is clearly observable as indicated in the H4 chart. Hence, we may presume that the resistance of $35.70 may be tested somewhere in the mid-term. And it’s about time because currently, the stock is checking the 6-months low of $33.