EUR/AUD: sideways or bullish?
Long-term
Since the beginning of 2017, the long-term trend of EUR/AUD has been a confident rise. On the weekly chart, February 2017 marks the beginning of that trend. During most of the year 2018, the currency was trading significantly above the support of the 50-week Moving Average. After having dropped below the 50-week MA at the end of 2018, it went into consolidation and more sideways, although, still above the 50-week MA and secondary support of the 100-week MA.
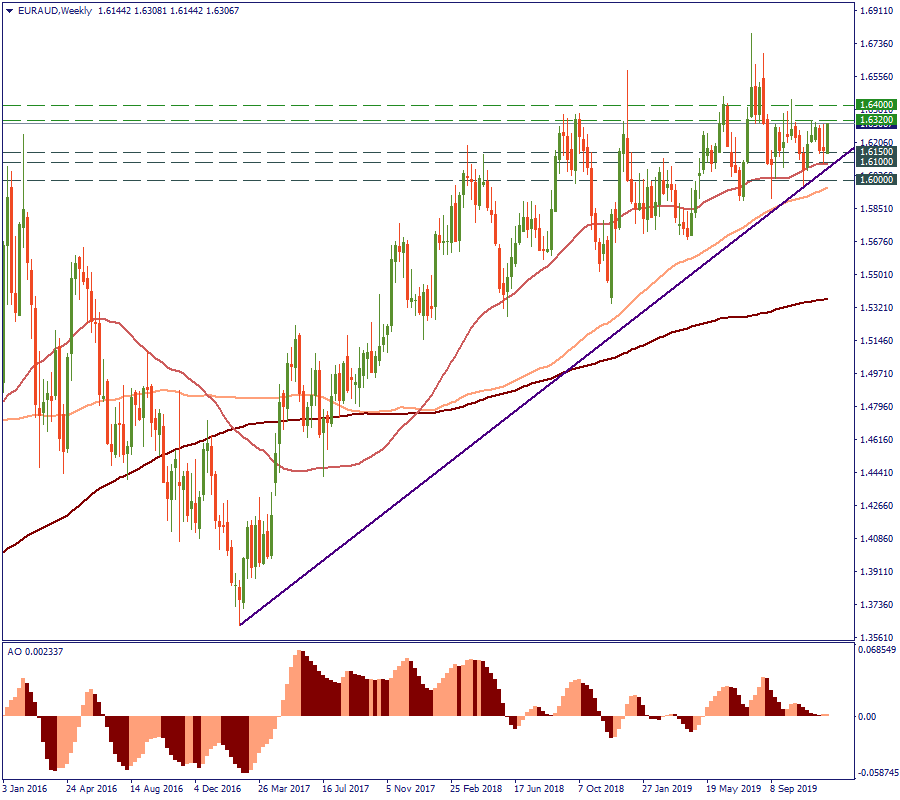
Currently, there is little evidence to foresee any change to this large trend. For this reason, we are assuming that the trend will continue. Therefore, the question is: will the consolidation and the sideways movement continue, or an upswing is going to take place shortly? A mid-term perspective may help to understand that.
Mid-term
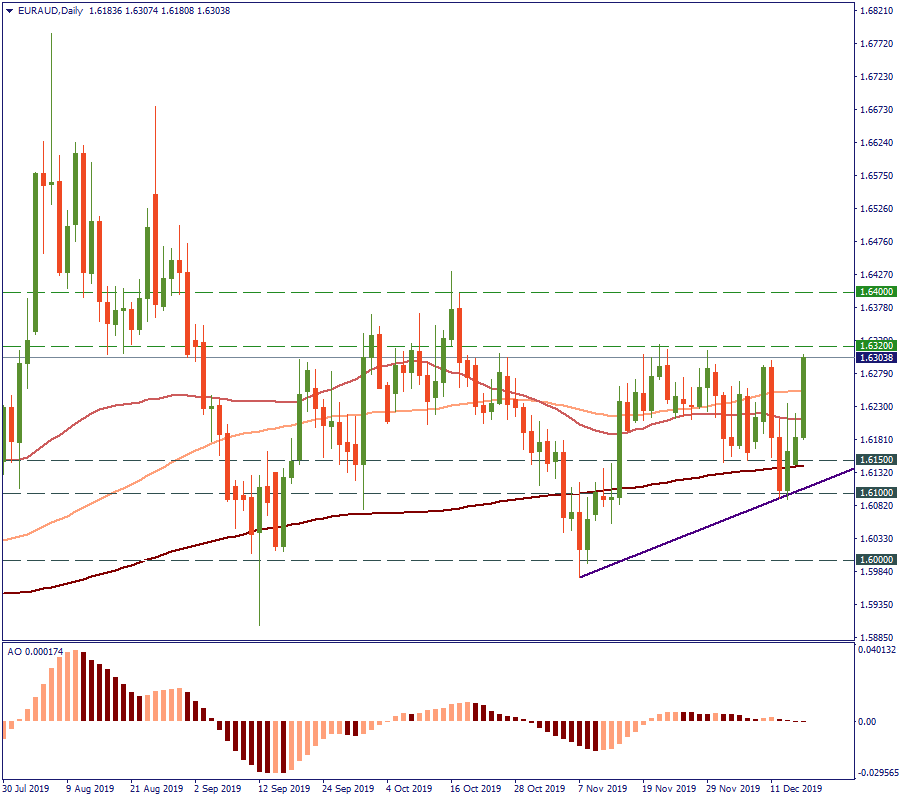
On the daily chart, the price has been mostly fluctuating between the 50-day and the 200-day Moving Average, having dropped twice to the support of 1.6000. Currently, it is testing the November resistance of 1.6320. If it is crossed, it may be a good sign that the price aims at the October high of 1.6400. However, we have to be careful looking at this level breakthrough. The Awesome Oscillator has decreased the fluctuation magnitude almost to zero and is seen drifting along the zero-line for the last two weeks. Preferably, we would like to see it rise with the price to have secondary confirmation for the market’s bullish intensions.
Conclusion
Therefore, the recommendation for this moment would be to hold positions and observe both the price and the indicator movement for more signals of the next step.
Also, following news would be a good help to see through the uncertainty of the EUR/AUD price action.