EUR/USD Upside Limited
EUR/USD Technical Analysis
The Backdrop
The EUR/USD has remained technically weak over the short, medium and long-term, bulls repeatedly struggled to rally the pair above the 1.1265 resistance level last month, which eventually led to the creation of a bearish head and shoulders pattern across the lower time frames.
Any moves higher in the EUR/USD pair have been increasingly driven by recessionary fears towards the United States economy rather that genuine buying interest towards the euro currency.
The week ahead offers plenty of scope for EUR/USD volatility with the United States economy releasing a raft of high impacting economic data and the European central bank delivering a rate decision and also their latest economic projections for the eurozone economy.
Technical Outlook
Sellers recently failed to bring the EUR/USD pair below the April monthly trading low, at 1.1109 level, which helped to create a bullish higher-low and further encouraged short-term technical buying in the EUR/USD.
Looking at the four-hour time frame, bulls are now attempting to build upside momentum above the EUR/USD pair’s 50-period moving average, while the MACD indicator on the four-hour time frame is now trending higher and is also attempting to turn bullish.
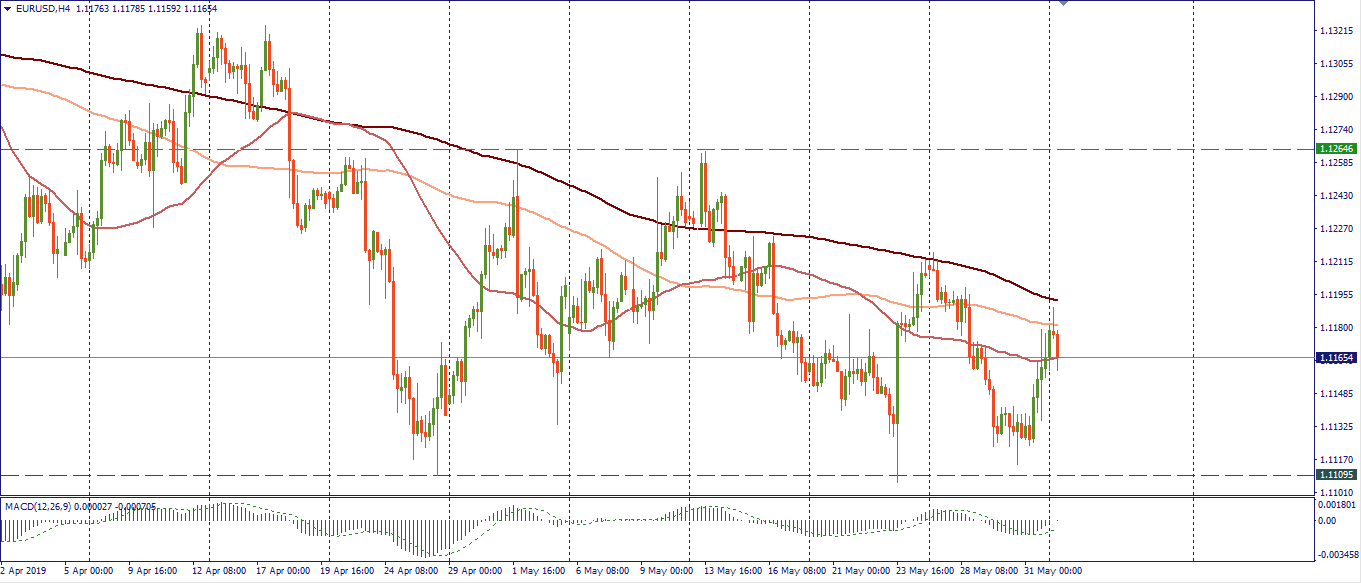
Key technical resistance on the four-hour time frame is now found at the EUR/USD pair’s 200-period moving average, at 1.1194, and the former weekly trading high, at 1.1215. Bulls will ideally need to rally the EUR/USD pair above its former weekly trading high to shift the negative short-term bias. Major medium-term resistance is found at the 1.1265 levels, with moves above this key area needed to negate the bearish head and shoulders pattern. Strong bullish moves above the 1.1265 level may eventually provoke a test of the pair’s key 200-day moving average, at 1.1377.
Going in-line with the current bearish trend, a bearish breakout below the 1.1109 support level this week will trigger the bearish head and shoulders pattern into action, which holds a downside projection of around one-hundred and fifty pips. Key support to the downside is located at the 1.1060 level and of course the psychological 1.1000 technical level.