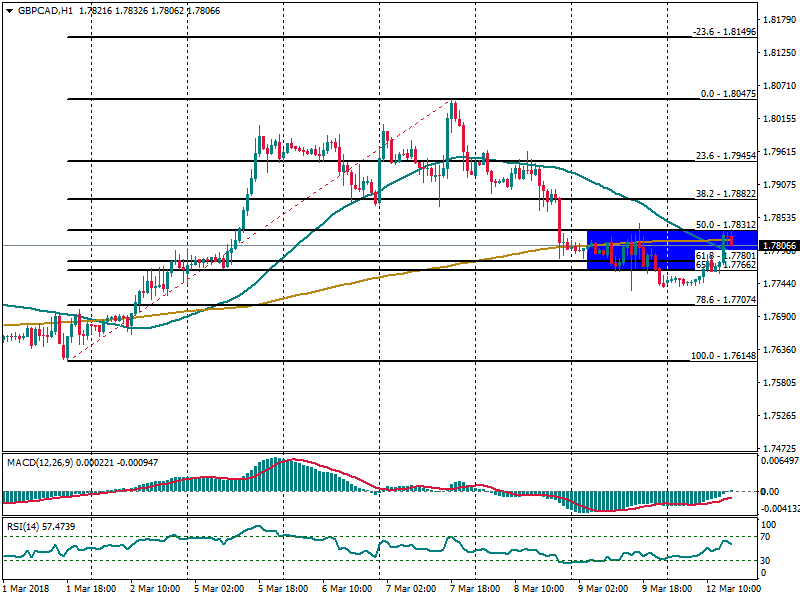
GBP/CAD hovering inside a buy area
Read the article on FBS website
The pair is consolidating the price action around the 200 SMA at H1 chart across the board and it’s facing a strong demand zone that could help to push it higher towards new highs. If the Fibonacci level of 65% at 1.7766 stays intact, GBP/CAD could rally to test the Fibonacci area of -23.6% at 1.8149. To the downside, if it does a breakout of last Friday’s lows, we can expect a leg lower towards the 1.7614 level.
RSI indicator stays in the positive territory and it’s close to the overbought zone.