GBP/JPY offers trade opportunities
If you look on the weekly chart of GBP/JPY, you will see that the pair has ran into resistance of the 200- and 100-week MAs (143.30 and 142.50). The price tried to fight these lines, but they are powerful obstacles. As a result, there are reasons to start questioning the uptrend, which has been in place since August 2019.
On the D1, GBP/JPY formed a series of lower high trading in a descending wedge. The Awesome Oscillator also drifted lower and lower. The key support lies at 140.35 (trendline support, Fibonacci). The loss of this level will open the way down to 139.30 and 137.90 (200-day MA). This scenario will come true if tensions between the United States and Iran keep escalating.
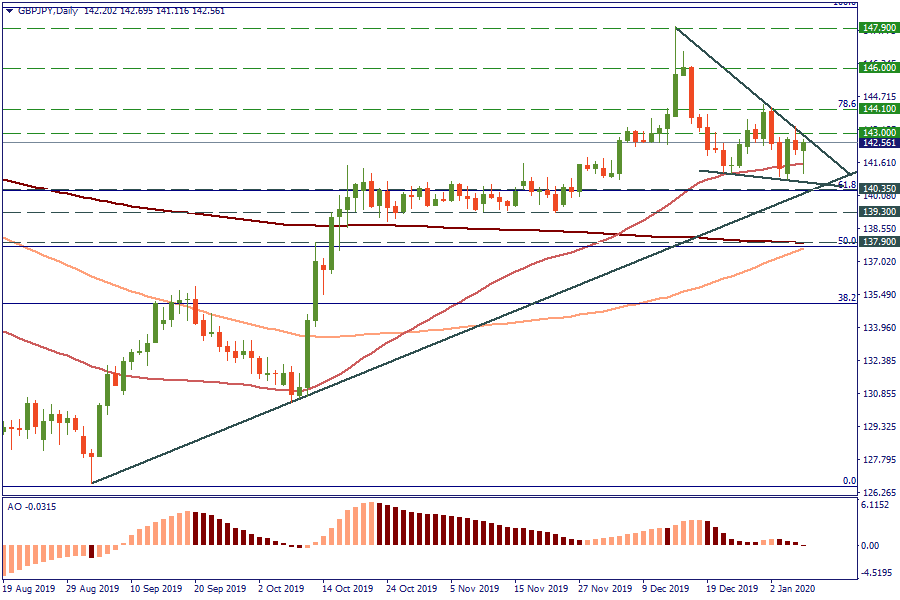
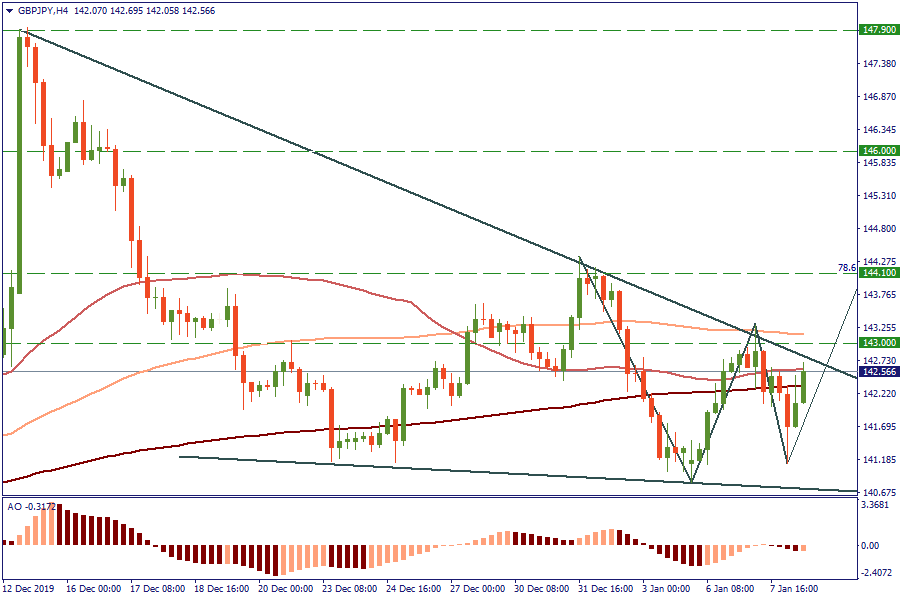
On the contrary, an advance above 143.00/15 is needed to open the way up to 144.00. At the same time, if such an advance takes place, the area between 144.00 and 146.00 should be considered for selling because the market will have formed a bearish harmonic pattern. A decline below 141.90 will also be a negative development.
Trade ideas for GBP/JPY
BUY 143.15; TP 144.00; SL 143.00
SELL 141.80; TP 141.25; SL 142.00