GBP/USD: developing 'Rising Wedge' pattern
Read the article on FBS website
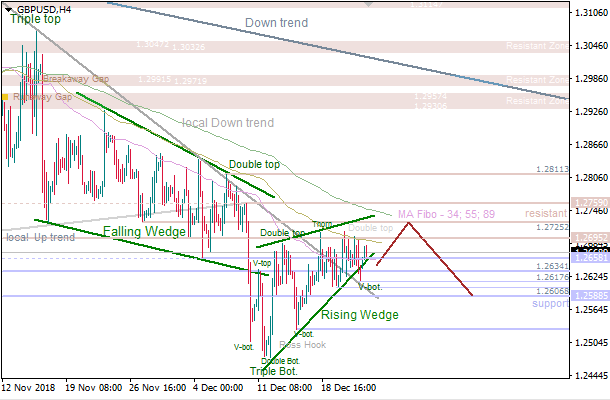
There's a developing 'Rising Wedge' pattern. Considering a local 'V-Bottom' pattern, it's likely that the price is going to test the next resistance at 1.2695 - 1.2725 shortly. If a pullback from this level happens next, there'll be a moment for a decline towards the nearest support area at 1.2606 - 1.2588.
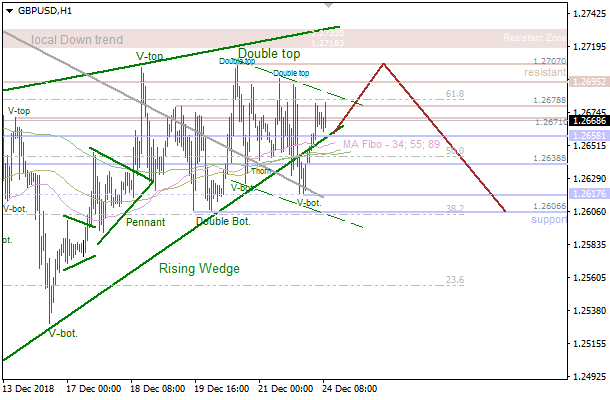
The pair is consolidating above the Moving Averages. Previously we had a 'V-Bottom' pattern, so we should watch the nearest resistance at 1.2695 - 1.2707 as an intraday target. The subsequent pullback from these levels could lead to a downward price movement towards another support at 1.2617 - 1.2606.