GBP/USD Selling Zone!
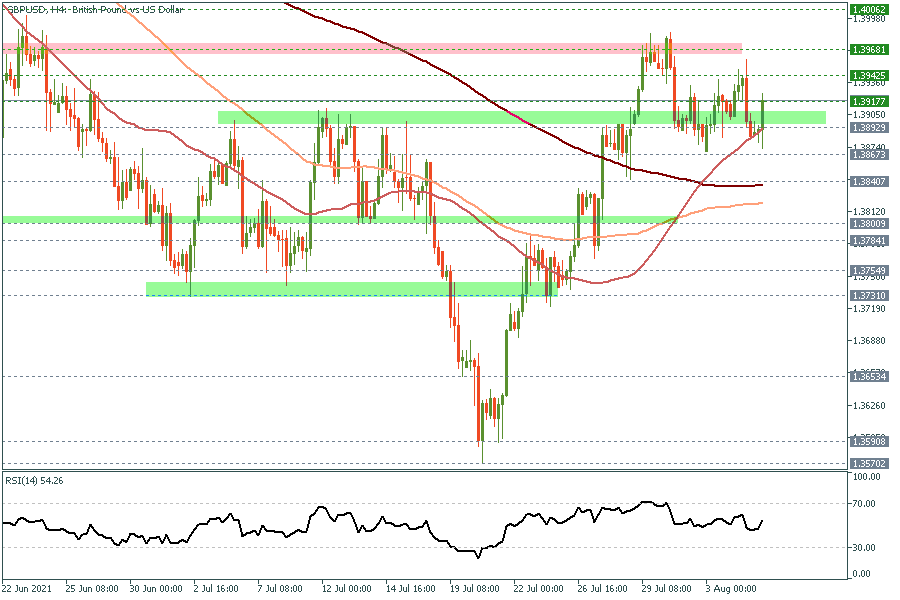
GBP/USD 4H Chart
GBP/USD Daily Chart
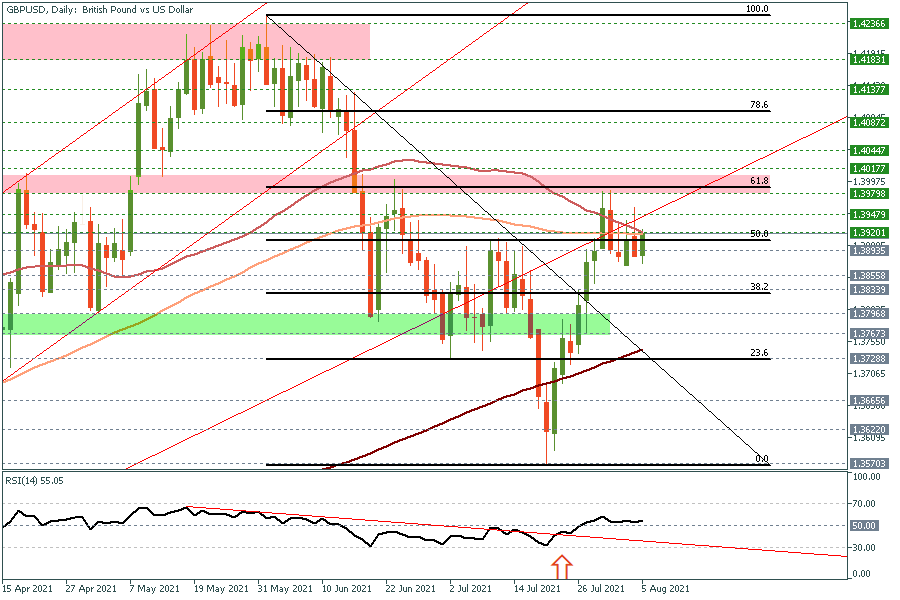
GBP/USD is currently trading within a new selling zone on both short and medium-term charts. The zone stands between 1.3915 and 1.3990 which represents its 50% and 61.8% of the recent selloff from June 1st top to July 20th bottom. This area remains solid since last week, while we wait for the Bank of England's decision later today. Yet, it would still be worth it to risk a short position with a stop above 1.4020, especially after the pair failed to break above its 100 and 50-day MA’s yesterday, while the technical indicators remain around the 50 mid-point (RSI). On the downside view, the first initial target would be 1.38 which could be seen later today, especially if the BoE decides to avoid tapering discussions.
| S3 | S2 | S1 | Pivot | R1 | R2 | R3 |
| 1.3767 | 1.3839 | 1.3864 | 1.3911 | 1.3936 | 1.3983 | 1.4055 |