NZD/CAD in a bearish reversal
Read the article on FBS website
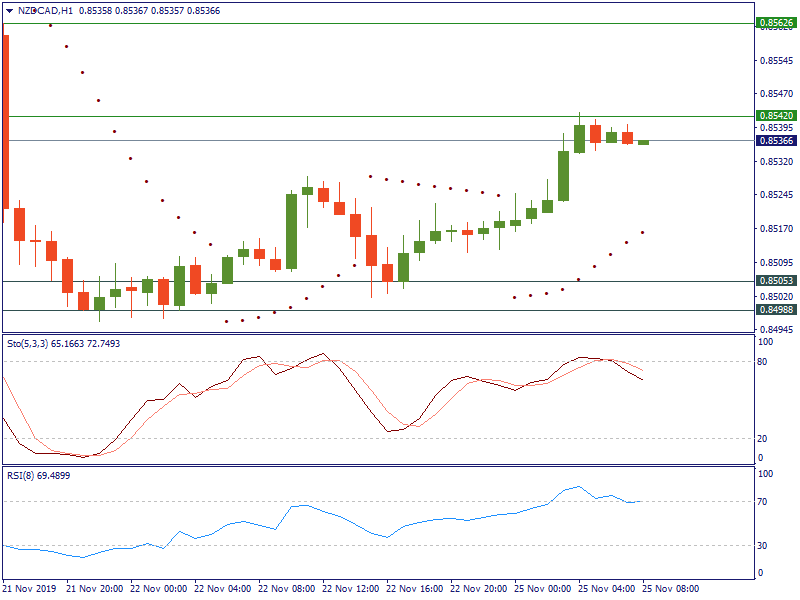
On the H1 chart of NZD/CAD, the price has started an uptrend last Friday. Currently, it has been consolidating at the resistance level of 0.8542. The Stochastic Indicator shows the fast line crossing the slow one upside down within the overbought zone. While the RSI indicator is about to cross the 70% upside-down. That means that the price is experiencing downwards pressure and is likely to decline. If it bounces down from the resistance level of 0.8542, the support levels may be located at 0.8505 and 0.8498. Otherwise, an additional resistance level may be placed at 0.8562.