PFIZER: a big triangle
Read the article on FBS website
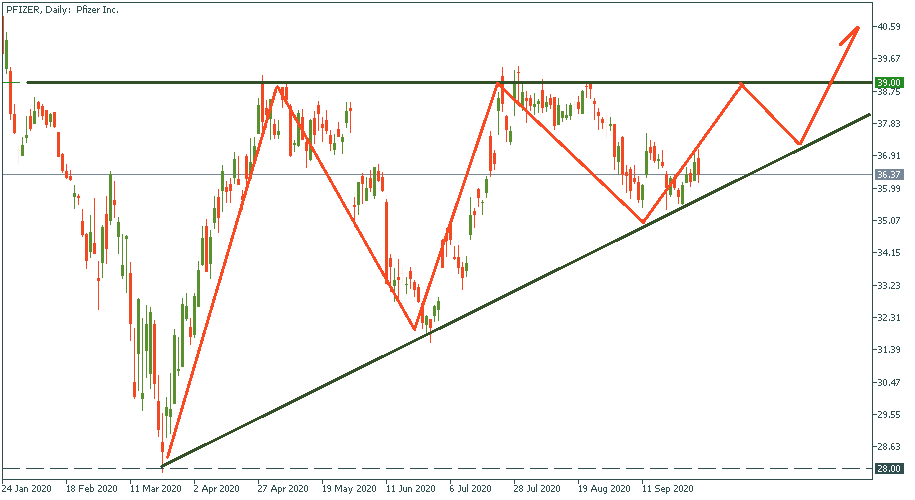
On the daily chart of Pfizer, we see a clear triangle being formed. It starts in March with the virus when the stock was at $28. Then the price went upwards – twice. And twice it was sent back down by the resistance of $39. Now, if the pattern keeps coherence, then we are likely to see the third upswing, another bounce downwards, and then a breakthrough beyond $39. The apex of the triangle is pretty for away though as we are looking at a daily chart, so don’t expect any breakthrough – as per this triangle pattern – earlier than in December this year. Fundamentally, this “plan” is quite feasible as the vaccine is expected in the end of Q4. So watch the news and keep your eyes on Pfizer stock.