S&P: the W-shape cyclical recovery
Read the article on FBS website
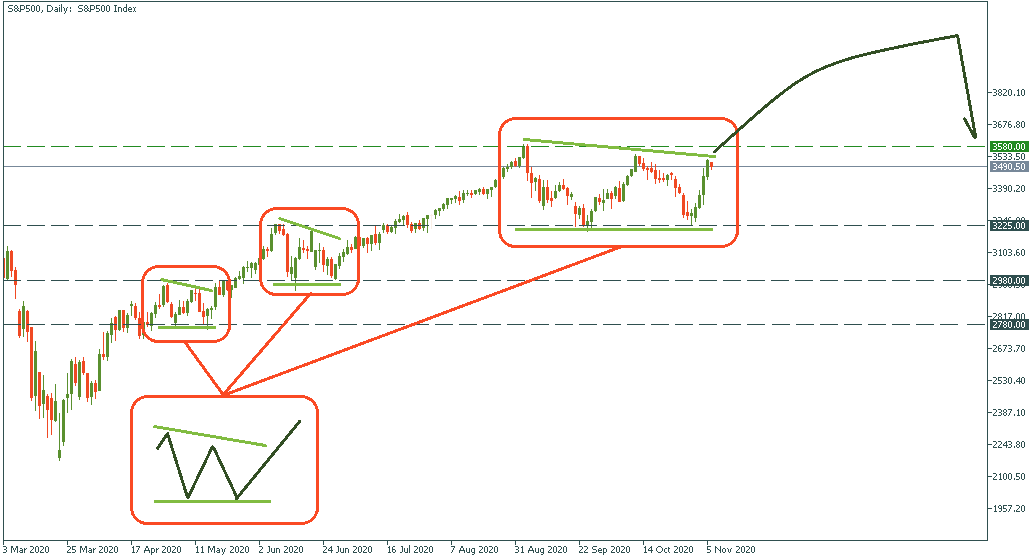
Let's look at the S&P daily chart. You can see the recent rise it made from 3 225 to almost 3 580. What's the strategic look though?
If the cyclical "logic" of the market (local bottom touched twise, two lower highs, and a breakthrough - a schematic sample is marked below) stays, we will see the S&P rise above 3 800 eventually. Probably, it will reach the area of 3 850. Over there, it will peak. Then, it will drop to 3 580 - the current resistance that wlil serve later a support level. The process will take not less than two months though so let's be patient and watch.
And as usual - take these predictions as hypothecial assumtions, all subjects to the actual conditions of the market and things to be time-checked and reality-checked.