USD/CAD Reversal Pattern
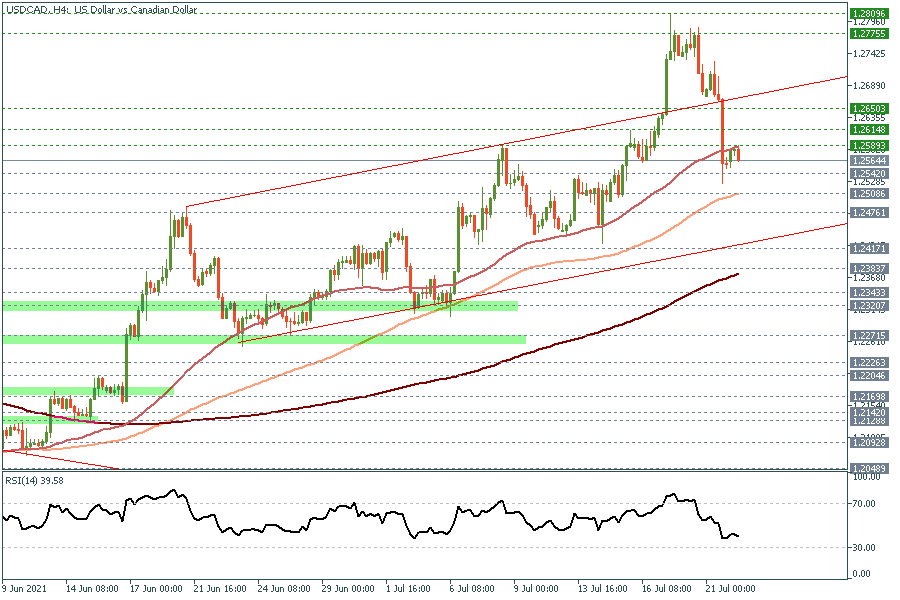
4H Chart
Daily Chart
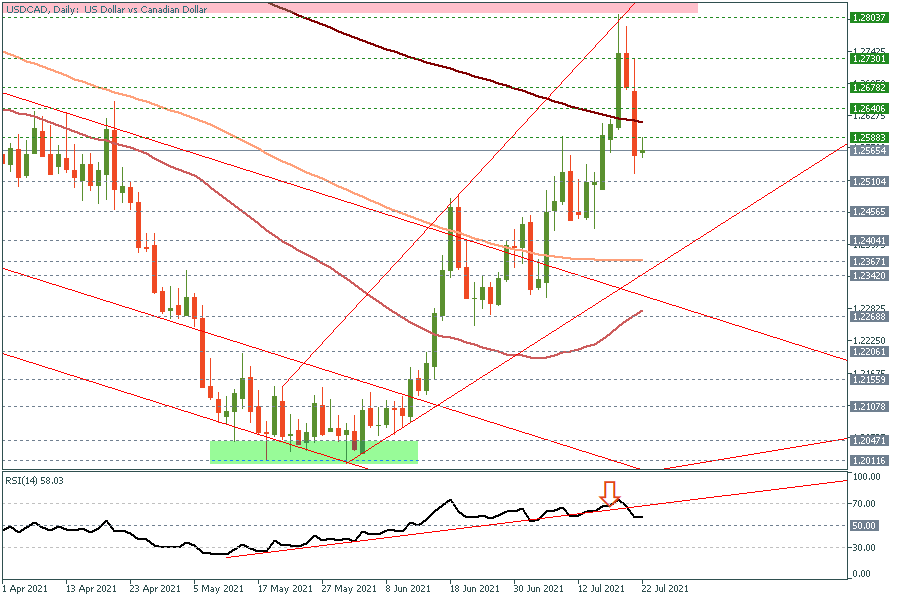
After a notable rally all the way to 1.28, USD/CAD dropped back to 1.2730 yesterday, confirming our outlook mentioned a few days ago about the need for a downside retracement before the upside trend resumes. In the meantime, USD/CAD is trading near the 1.27 support area which should be watched carefully, while any upside rally Is likely to be limited now below 1.2810 which is this week’s high. RSI already broke its uptrend line on the daily chart, which could be seen as a new shorting opportunity but only in the short term with a stop at this week’s high, with a possible target of 1.26 followed by 1.2550 for now.
| S3 | S2 | S1 | Pivot | R1 | R2 | R3 |
| 1.2196 | 1.2400 | 1.2478 | 1.2604 | 1.2682 | 1.2808 | 1.3012 |