USD Resistance Remain Solid
Read the article on FBS website
Daily Chart
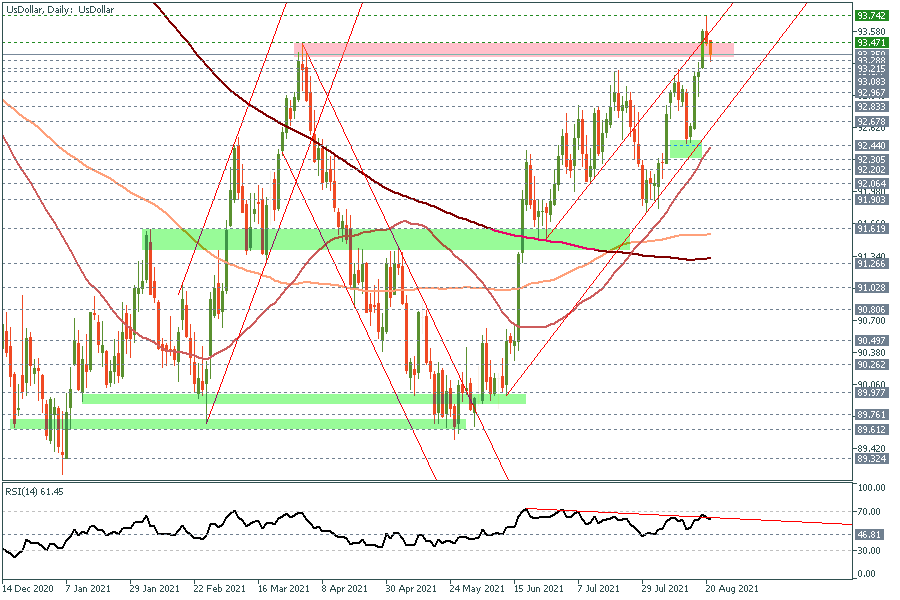
The US Dollar Index tried to break above 93.50 at the end of last week trading. However, it failed to do so, declining all the way back on Friday, forming a clear bearish shooting star on the daily chart. Earlier in Asia, the index dropped further to 93.30. In the meantime, this should not be a surprise, especially that the technical indicators are nearing overbought area, while the RSI is still trading below its downtrend line on the daily chart, which keeps the door open for another leg lower, possibly to retest 93.0 – 92.80 area before the uptrend resumes.
| S3 | S2 | S1 | Pivot | R1 | R2 | R3 |
| 92.96 | 93.26 | 93.38 | 93.55 | 93.67 | 93.85 | 94.14 |