The Bull Power and Bear Power are the oscillators developed by Dr Alexander Elder. They measure the power of buyers (bulls) and sellers (bears) to push the price in their favor, i.e. above or below a baseline. The two indicators combined are known as Elder-Ray Index. The function of a baseline is often performed by a 13-period Exponential Moving Average (EMA) of closing prices.
The logic is simple: the market situation is constantly changing as bears turn into bulls and vice versa. The indicators help to track this conversion and trade on it.
How to implement
The Bull Power and the Bear Power belong to the default set of MetaTrader. You can add them to the chart by clicking “Insert” – “Indicators” – “Oscillators” and then choosing “Bull Power”/“Bear Power”.
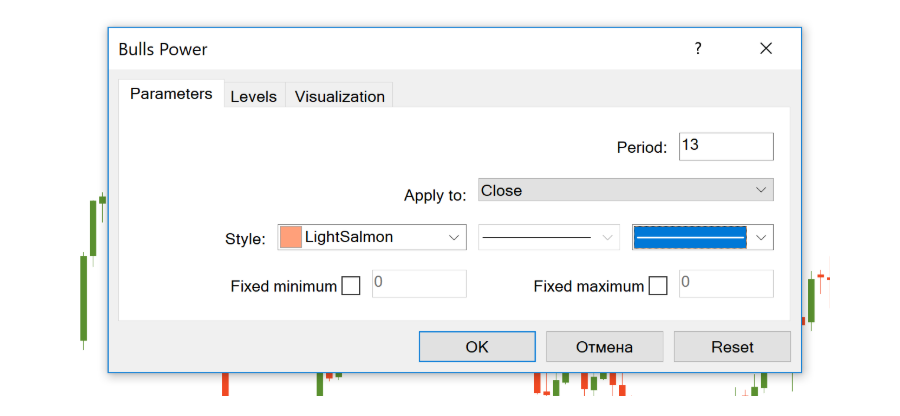
You can use the indicators individually but there’s much more sense to use them together as was planned by Elder. In addition to both indicators, plot the 13 EMA itself on the chart as well. This way you will combine the oscillators with a trend-following tool and increase the quality of the entry signals. The exponential moving average acts as a filter: it shows a trend, so that a trader could pick only those signals which are in the direction of this trend.
How to interpret indicators of Bulls Power and Bears Power
All 3 indicators form a kind of basis for a trading strategy.
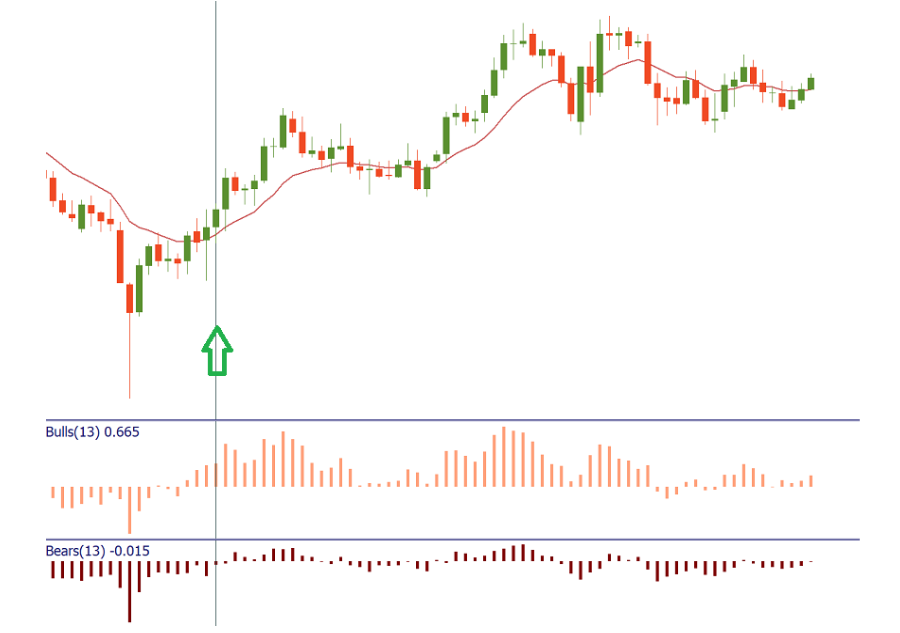
A setup for a buy trade occurs when the following conditions are met:
- EMA is increasing.
- Bears Power is negative but increases.
There are also other optional cut desirable conditions:
- The last peak of the Bulls Power oscillator is higher than the previous one.
- There’s a bullish divergence between the Bears Power and the price (the price is setting lower lows, but the Bears Power fails to do so).
It is better not to go long if the Bears Power is positive.
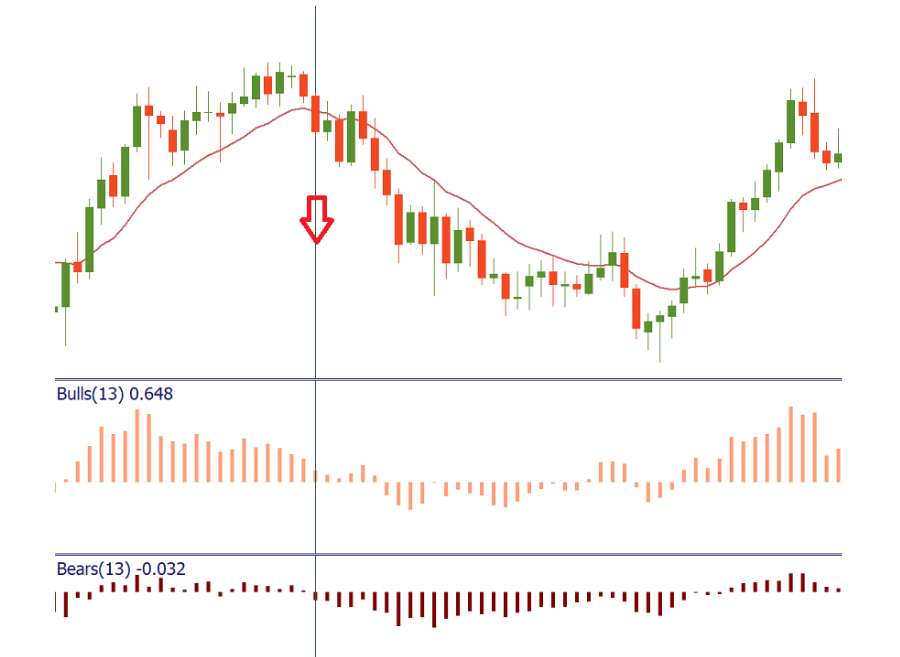
A setup for a sell occurs when the following conditions are met:
- EMA is decreasing.
- Bulls Power is positive but decreases.
There are also other optional cut desirable conditions:
- The last low of the Bears Power oscillator is lower than the previous one.
- There’s a bearish divergence between the Bulls Power and the price (the price is setting higher highs, but the Bulls Power only manages to form only lower highs).
It is better not to go short if the Bulls Power is negative.
All in all, the Bulls/Bears Power indicator allows seeing the forces that are driving the market and suggest a simple but efficient basis for a trading strategy.