What is a Butterfly pattern
The Butterfly is another form of Gartley pattern. It was discovered by Bryce Gilmore and Larry Pesavento. This pattern usually forms near the extreme lows and highs of the market and predicts a reversal.
The main special thing about the Butterfly pattern is that CD extends beyond XA.
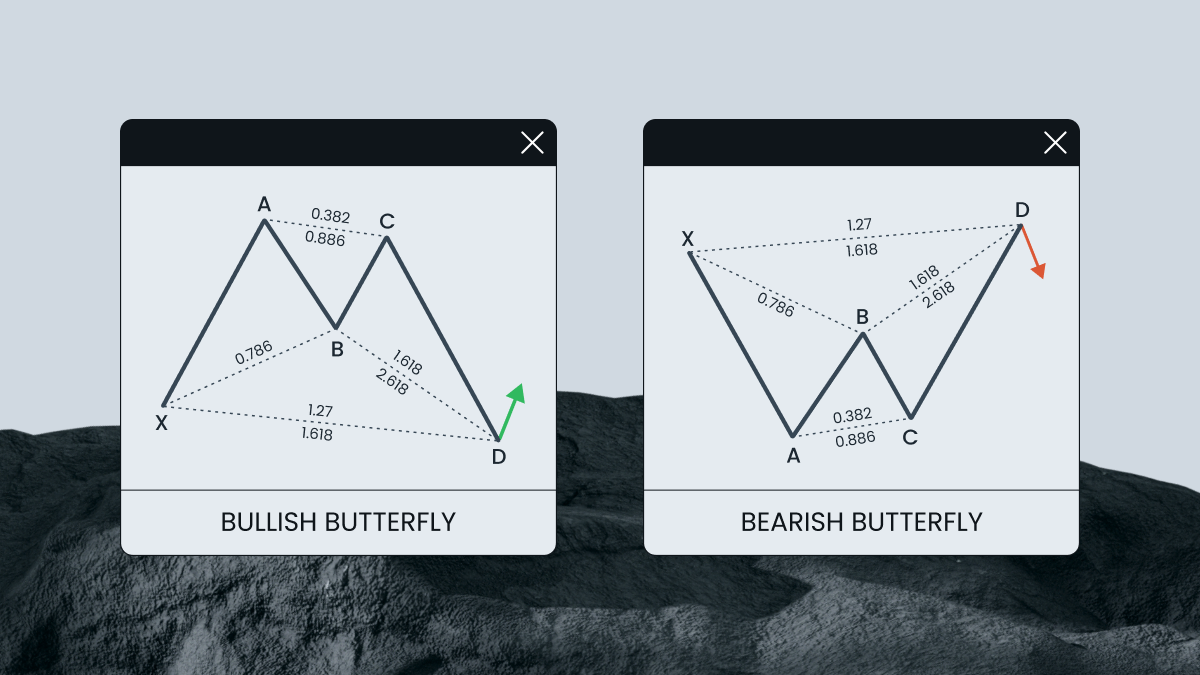
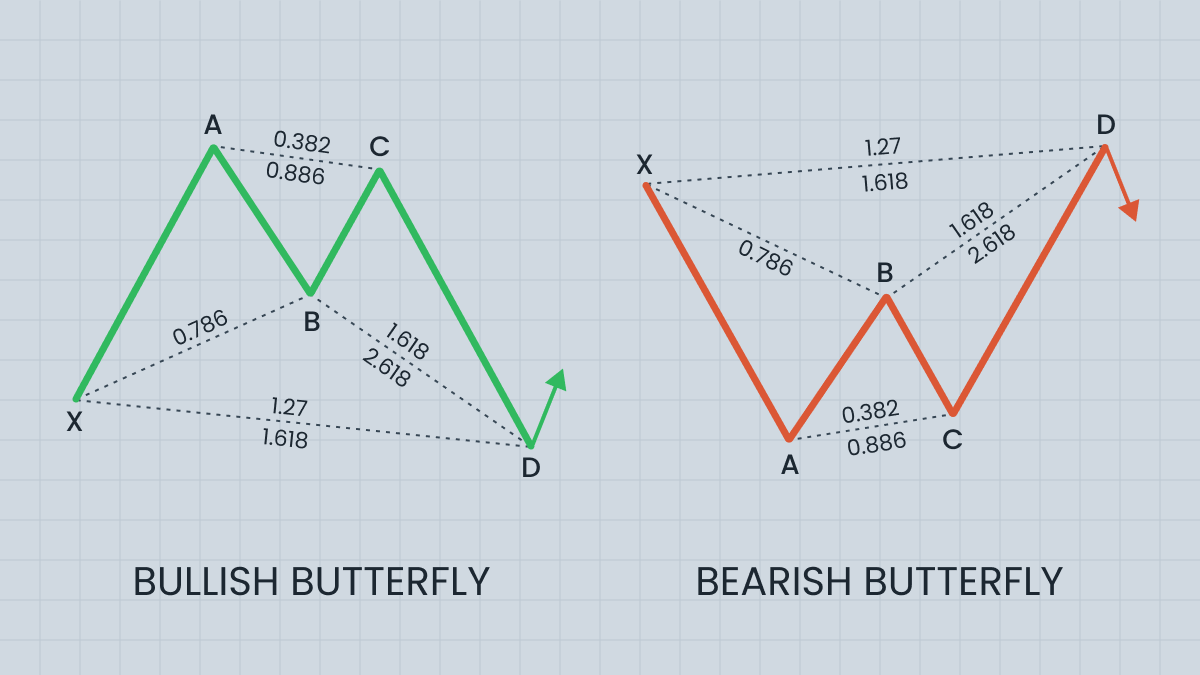
Here are the key parameters of a Butterfly pattern:
Point B is at up to 78.6% retracement of XA.
Point C can be at the 38.2%-88.6% retracement of AB.
Point D can be found at the 161.8%-261.8% extension of AB or at the 127.2%-161.8% extension of XA. The difference from a Gartley pattern is that D is not at the retracement of XA, but at its extension.
How to identify and trade on a Butterfly pattern
Bullish Butterfly pattern: Forms at the end of a downtrend. When the C-D leg completes, it signals a potential upward reversal. Traders look for buying opportunities here.
Bearish Butterfly pattern: Forms at the end of an uptrend. When the C-D leg completes, it signals a potential downward reversal. Traders look for selling opportunities here.
Fibonacci retracement tool - Measures the retracement levels of each leg in the pattern. Applying this tool to the XA, AB, and BC legs helps identify the key levels defining the Butterfly pattern.
Take-profit may be at 61.8% of CD (TP1), and/or at 127.2% of CD (TP2). You can also target points B (a conservative approach) and A (an aggressive approach).
Put a stop-loss in line with your rules of risk management.
Here is an example of a bearish Butterfly pattern.
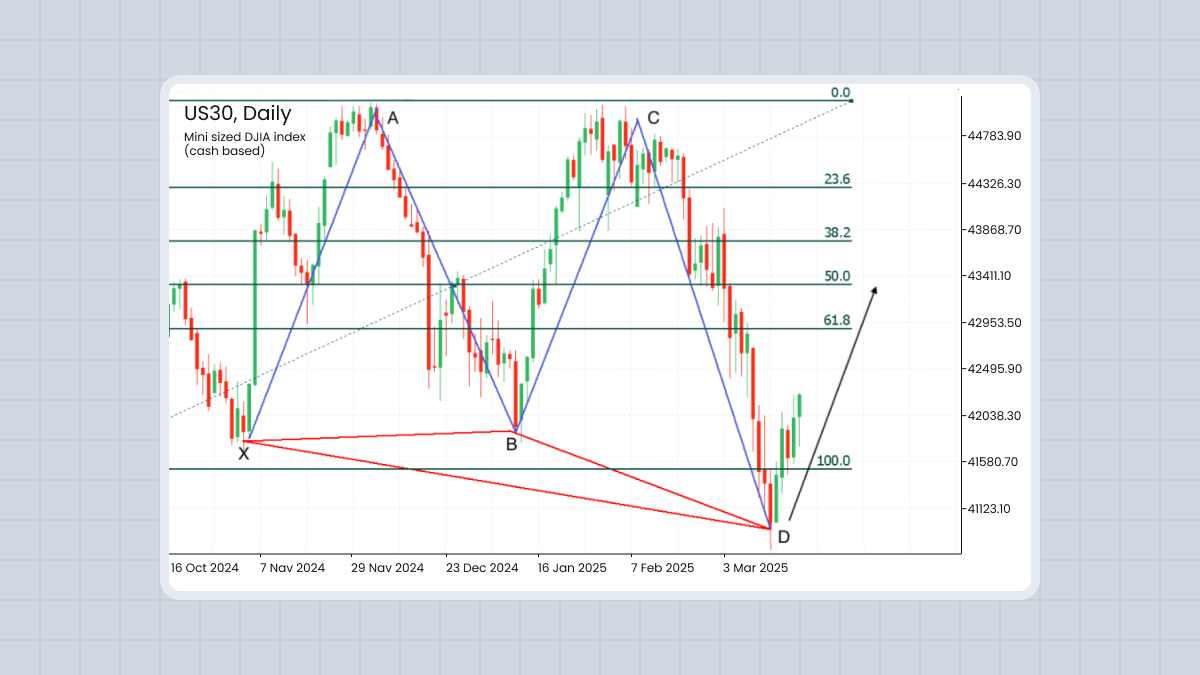
The point B is at the 78.6% retracement of XA. Point C is at the 76.8% retracement of AB. Point D is at the 127.2%-161.8% extension of XA.
Summary
The Butterfly pattern is a powerful tool in technical analysis, helping traders predict market reversals with high accuracy. By understanding its structure and specific Fibonacci ratios, traders can identify precise entry and exit points, manage risk effectively, and enhance their trading strategies. Whether you’re trading in Forex, stocks, commodities, or cryptocurrencies, the Butterfly pattern offers versatility and reliability.