Below you can find the schemes and explanations of the most common continuation candlestick patterns.
Continuation of an uptrend
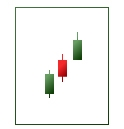
Upside Tasuki Gap
A bullish candle forms after a gap up from the previous white candle. The next candle opens lower and closes lower than the previous one.
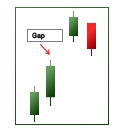
If the gap is not filled, the bulls have maintained control and it’s possible to enter a buy trade or increase an existing long position. If the gap was filled, the bullish momentum has ended.
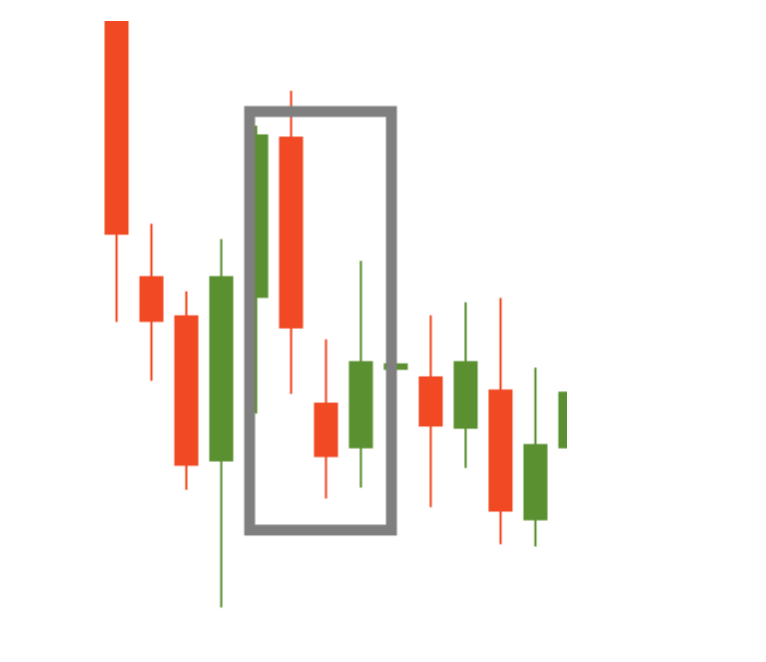
Upside Gap Three Method
This pattern is very similar to the Upside Tasuki Gap. The pattern occurs in a strong trending market. In an uptrend, a gap occurs between 2 bullish candlesticks.
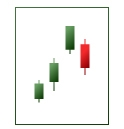
The final day opens within the body of the top bullish candlestick and closes within the body of the lower bullish candlestick, filling the gap between the two candlesticks.
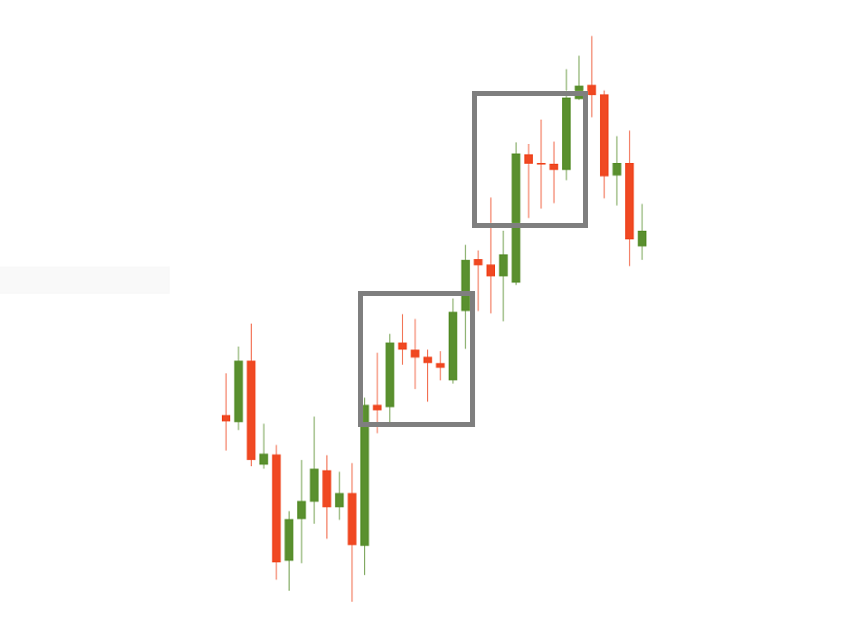
Rising three methods
After a long bullish candlestick, there’s a series of small bearish candles. The optimal number of these pullback candles should be 3, though 2, 4 or 5 correction candles can also be observed. It’s important that these bearish candlesticks do not close below the opening level of the first big bullish candle.
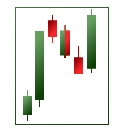
Their shadows also shouldn’t go below the bullish candle’s open. The final candle of the formation should open up in the body of the last bearish pullback candle and close above the first big bullish candlestick. If you are familiar with chart patterns, you will notice that this pattern strongly resembles a bullish flag. The logic of the two patterns in the same: the market corrected down after a strong advance, but then buyers got ready to resume pushing the price higher.
Mat hold
After a large bullish candlestick, there’s a gap up followed by a series of small bearish candles. The second or the third one of them dips into the body of the large bullish candlestick. The final candle of this pattern gaps to the upside and it continues its upward movement to close above the trading range of any of the previous periods. This is a good point to add to bullish positions.
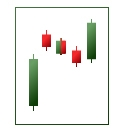
During the days of the correction, unlike the “Rising three methods”, the price stays close to the top of the first bullish candle’s range. The “Mat hold” candlestick pattern is a stronger continuation pattern than the “Rising three methods”.
Three Line Strike
After the 3 strong bullish candles that close progressively higher and indicate that the uptrend continues (the so-called “3 white soldiers”), there is a big “strike” candle which opens higher, but then pulls back to close below the open of the first bullish candlestick.
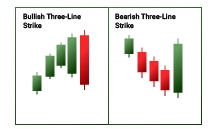
Make sure that the first 3 candlesticks are at least of average size. If they are small or doji, the pattern won’t be reliable. All in all, the “Three line strike” pattern means that the strike candle is a temporary correction and that after it the trend will resume in the direction of the first 3 candles.
A bearish “Three line strike” pattern mirrors the bullish one. It consists of the 3 strong bearish candles that close progressively lower and are followed by a single bullish “strike” candle. The strike candle should open lower than the close of the third candle and close above the open of the first candle.
Separating lines
The pattern should take place during an uptrend. It consists of a long bearish candlestick followed by a long bullish candle, which opened at the same level that the bearish candle had opened (there’s a gap there which may be seen on smaller timeframes). The bullish candle should be without a lower wick. Although they share the same opening price, the two candles are separated because they move in opposite directions.
The pattern means that although sellers were able to seize control of the market, it was only for a short period of time and then buyers became even stronger than before. The longer the candles in the bullish “Separating lines” pattern are, the more reliable this pattern is. However, it’s always safer to wait for confirmation in the form of another bullish candlestick after the pattern.
Continuation of a downtrend
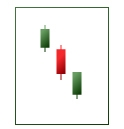
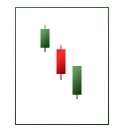
Downside Tasuki Gap
Look for a gap down between the two bearish candlesticks. The next candlestick should open higher and close higher than the previous one.
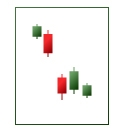
If the gap is not filled, bears have maintained control. It means that it’s a good time for opening or increasing a short position. If the gap was filled, then the bearish momentum has ended.
On neck
The first bearish candle opens with a gap down and has a long body. The second candle is bullish and reaches only the low of the previous day, not its close level.
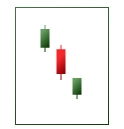
The pattern means that although bulls try to seize power, they fail to push the price high enough, so the downtrend continues after the brief bullish correction.
In neck
The pattern is similar to the “On neck” pattern except that it closes at the close or just slightly above the close of the previous day. The “In neck” pattern indicates that there was some short covering, but the trend direction didn’t change and remained bearish.
Thrusting
This pattern resembles “On neck” and “In neck” patterns, except that the bullish candle closes near, but slightly below the midpoint of the previous day’s black body.
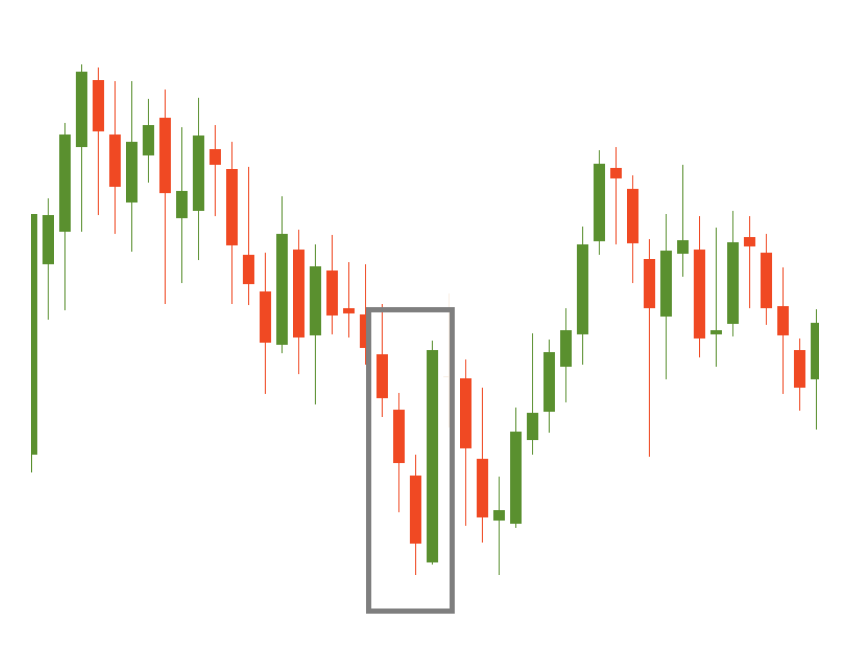
Falling Three Method
After a long bearish candle, there’s a series of 2-5 small bullish candlesticks. It’s important that these bullish candles do not close above the open of the big bearish candle. Their shadows also shouldn’t exceed the bearish candle’s open. The final candle of the formation should open in the body of the last bullish candle and close below the first big bearish candle’s close.