Retracements
Usually, a correction tests one of the Fibonacci levels of the previous wave. The most common levels are 0.236, 0.382, 0.5, 0.618, 0.786. The last one is √0.618, which quite often turns out to be a useful level. As we already know for the previous article, there's such a thing like alternation, which means there's a special relationship between waves two and four of an impulse. One of these corrections could be sharp, and another one expresses itself in a sideways shape. At this point, we could use Fibonacci levels as a helpful tool, so let's examine some examples.
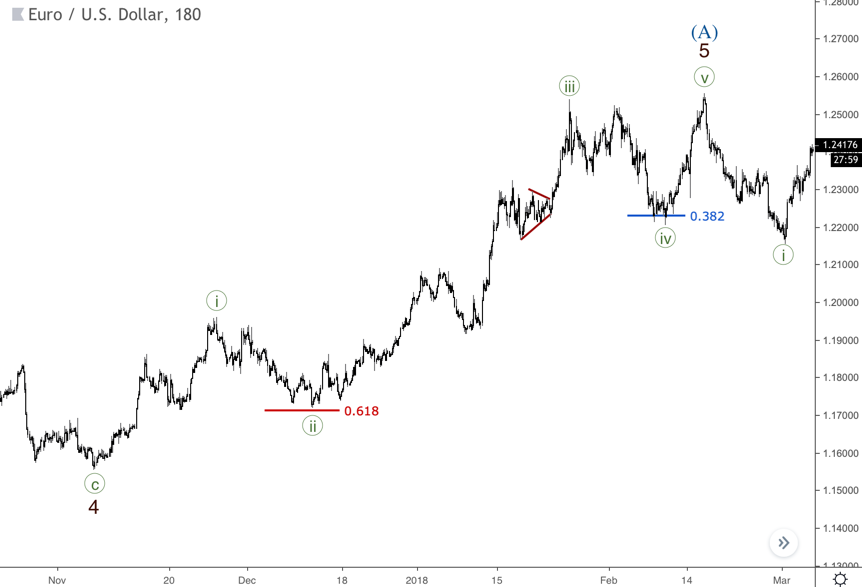
The chart below represents a classic relation between the second and fourth waves. Wave ((ii)) reached the 0.618 level while wave ((iv)) achieved just the 0.382 level of the wave ((iii)). In most cases, the second wave is deeper in relation to the preceding wave than the fourth wave. Thus, in most cases, we should watch the 0.618 level as the main target for the second wave, but there're always some exceptions and these guidelines are not written in stone.
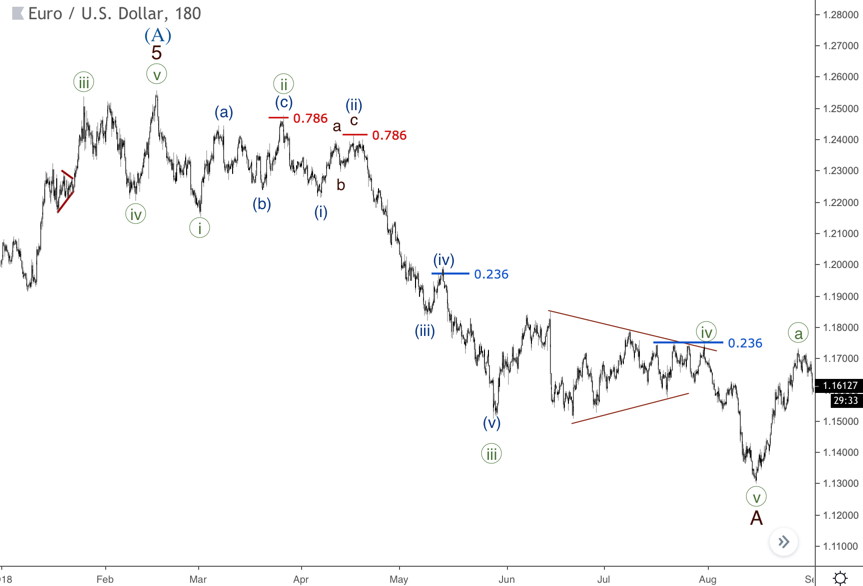
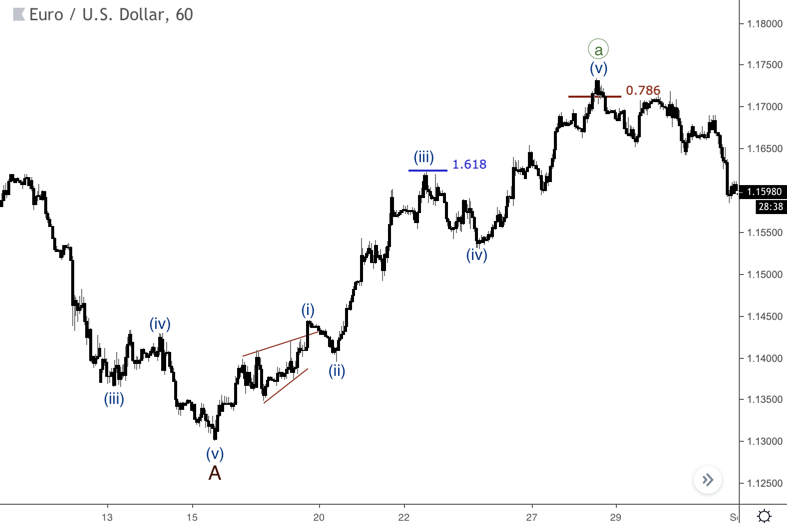
As mention above, the 0.786 level could also be a target. The next chart shows the case exactly. Wave ((ii)) and then wave (ii) finished on the 0.786 levels and both of them were a departure point for a bearish wave. At the same time, both waves (iv) and ((iv)) retraced only 0.236 of the previously formed third wave. So, that's another example of how alternation works.
Which level we should pick as a target
Even though the 0.618 level is the primary target for wave two, we should watch a structure of the correction as well. So, we should only consider wave two as ended when we have two factors on board such a finished correction structure and a pullback from one of the Fibonacci levels. This approach reduces the risks of premature opening trades and losses as consequences of that.
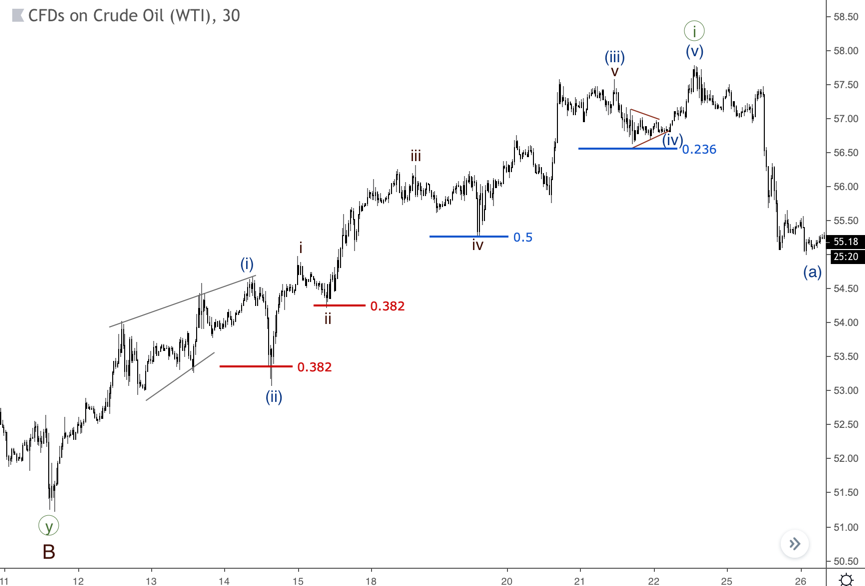
Let’s have a look at wave ((iv)), which took the form of a triangle. The ending of this pattern tested the 0.236 level, which kicked off a downward five-wave rally. This shows that we should match the ending of a triangle and the Fibonacci levels, but not the internal parts of the pattern.
If a rally is that strong, waves two could be weak. The next chart represents this case. Both waves (ii) and ii reached just the 0.382 levels and the market continued rising. Again, it's all about the form. If we have a three-waves price movement, which we could consider as a complete correction, and then a pullback from the 0.382 level happens, then it could be enough for wave two. On the other hand, we should remember about the possibility to have a more prolonged correction as a double zigzag. Thus, whatever pattern or pullback you see, there's always no reason to forget about the risk management.
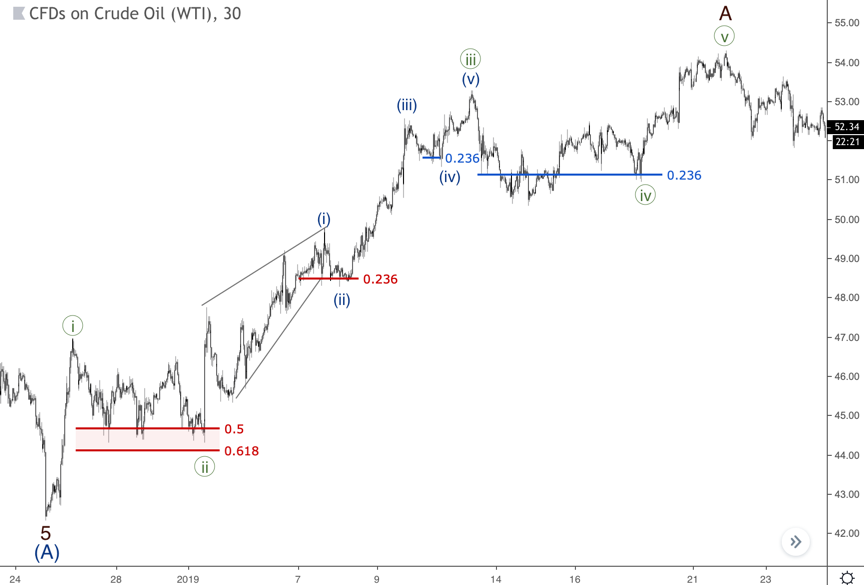
Sometimes, wave two balances between the 0.5 and 0.618 levels. If there is a couple of pullbacks from these levels, that brings more evidence that's wave two is about to end. Also, during extension, it's common to have relatively small wave two. As you can see on the chart below, wave (ii) ended on the 0.236 level as well as wave (iv). That's more common on the stock market, where we could have rallies like a rocket quite often, so in moments like that, the price simply has no time for deeper corrections.
Fibonacci Extensions of Motive Waves (Multiples)
We can use the Fibonacci Extension tool to predict the length of waves three and five. The most common target to the third wave is the 1.618 multiple of the first wave. The fifth wave tends to reach the 0.618 multiple of the third wave. Such classic relations you can see on the next chart.
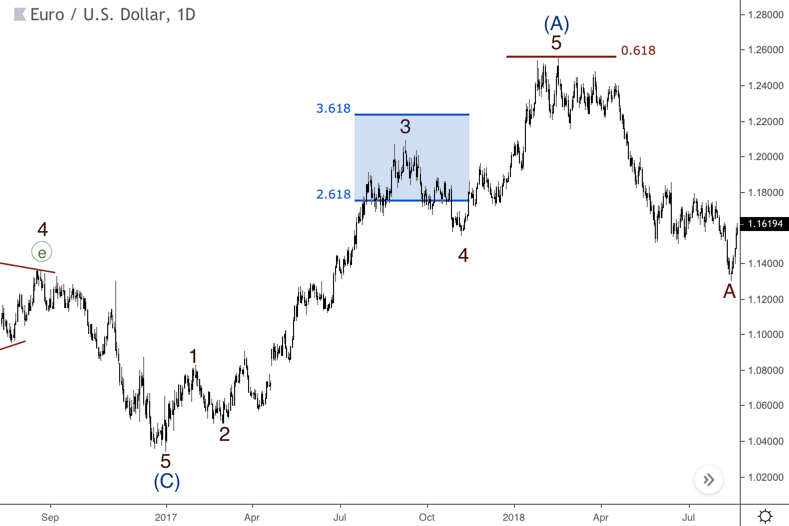
Sometimes, an extension in the third wave turns out to be so long and in this case, we should watch 2.618, 2 and 3.618 levels as possible targets. As you can see on the chart below, wave 3 finished between the 2.618 and 3.618 levels. Again, it all depends on the wave structure. Thus, if the third wave reached the 1.618 level, but there's no finished five-wave price movement, then it'll be logical to watch the next levels as a target.
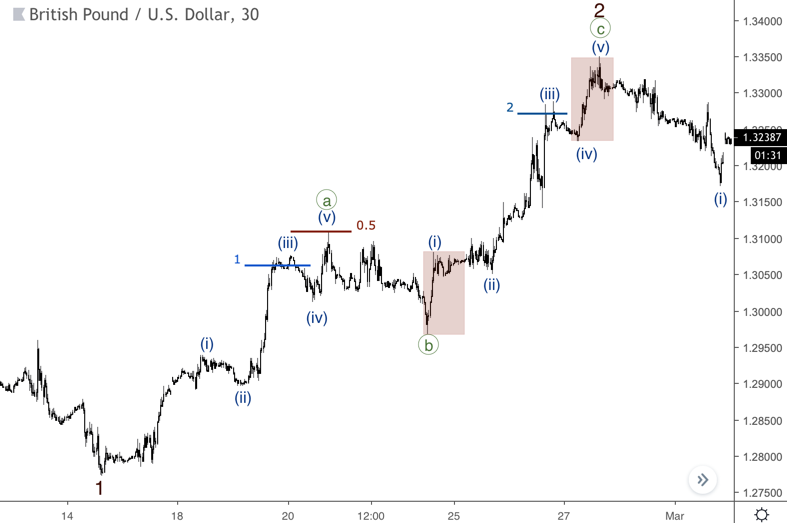
From time to time, 1 and 2 multiples are also could be useful. Wave (iii) of ((a)) on the next chart finished at 1 level, while wave (iii) of ((c)) achieved the 2 multiple levels. In both cases, the inner structure of these third waves was helpful to recognize a possible ending of these impulses.
Also, let's have a look at waves (i) and (v) of ((c)), which are equal. Usually, this happens if the third wave is more than 1.618 multiple, but again we should rely on the wave's structure first.
The Bottom Line
The Fibonacci relations are the core part of the Elliott Wave Principle. The structure of a developing wave could point out the appropriate Fibo level as a target, so we should always try to match the ongoing wave and the nearest level to achieve the best results.