The aim of this method is to recognize specific market structures called “harmonic patterns” and use them to generate trade ideas.
Harmonic patterns were discovered by H.M. Gartley in 1932. Later, the theory was developed by Larry Pesavento, who wrote the book “Fibonacci Ratios with Pattern Recognition.”
Harmonic patterns are similar to chart patterns like the Head and Shoulders in that they are based on a specific shape of price action. However, there is something special about harmonic patterns: they are based on the use of Fibonacci tools (retracements and expansions). Such a combination allows these patterns to produce accurate and reliable trade signals. The main idea is to identify the levels at which the general trend will resume after a correction as well as this trend’s targets.
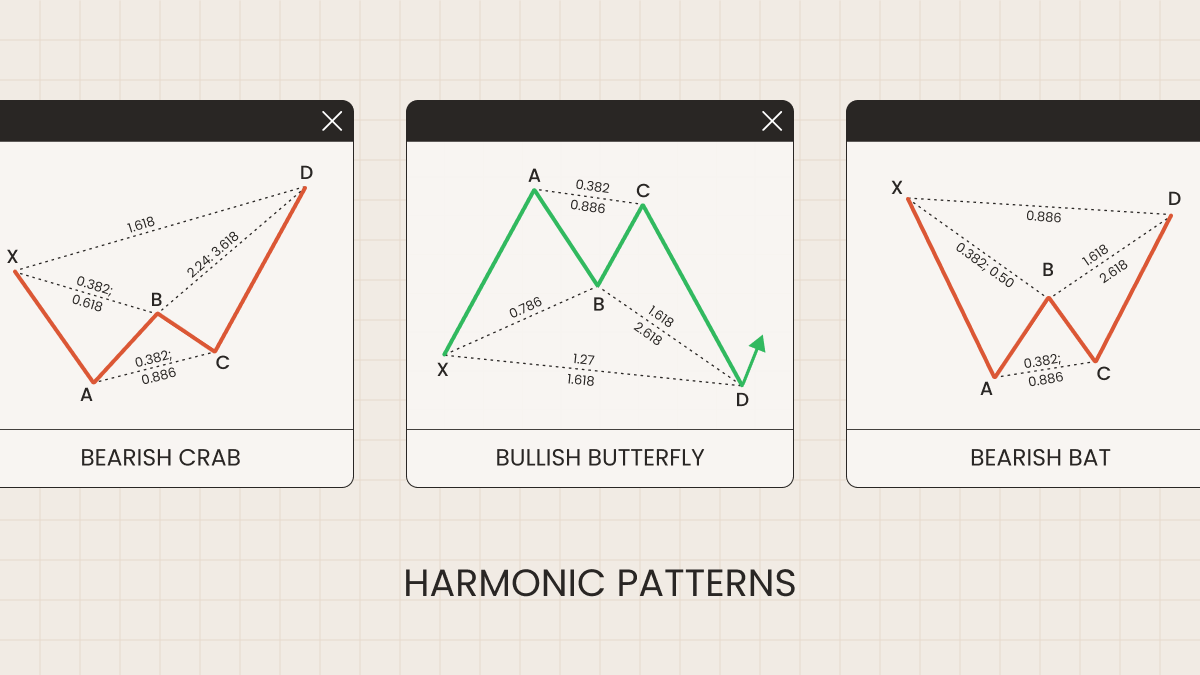
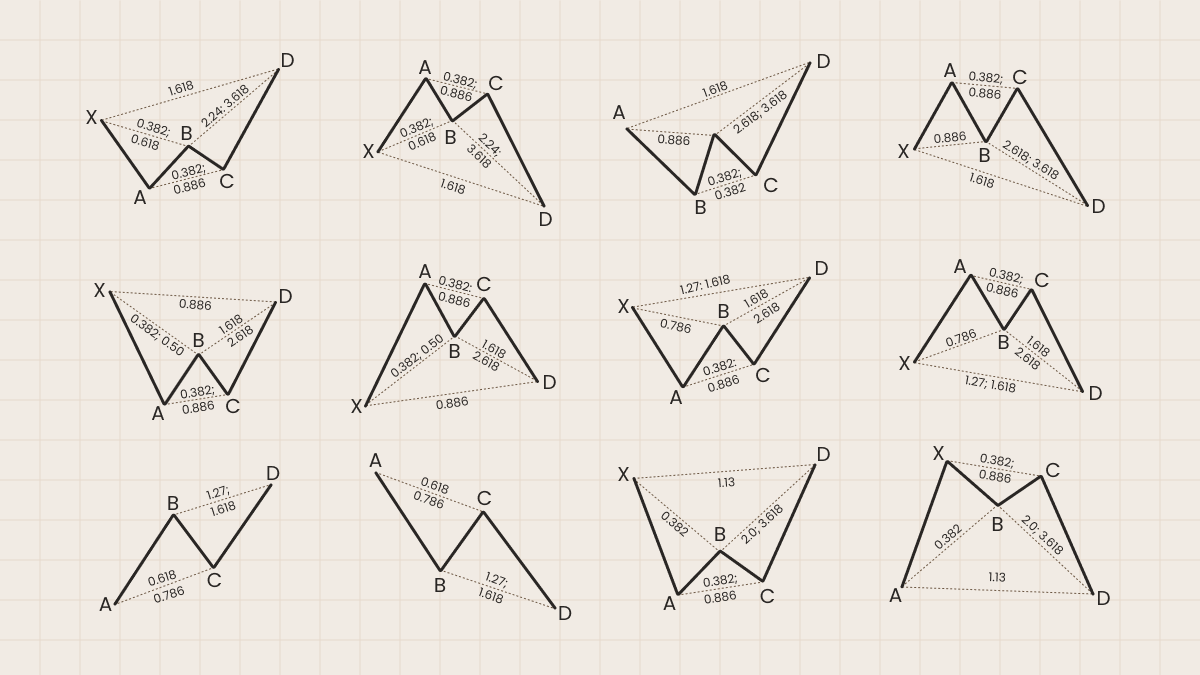
There are many different harmonic patterns: ABCD, Butterfly, Gartley, Shark, Crab, Bat, etc. These patterns can be either bullish or bearish. Many patterns may look similar to each other but have some distinctions. The art of harmonic trading is the ability to differentiate between these patterns.
Technical analysis assumes that history repeats itself. The idea is that these patterns will occur in the future and will have the same effect as they did in the past.
The schemas of various harmonic patterns
We will explain how to trade each pattern in further articles.
The main advantage of harmonic patterns is that you don’t need to make guesses, but can rely on specific Fibonacci numbers.
The numbers used in harmonic patterns are either directly or indirectly derived from the 0.618 and 1.618 ratios of the Fibonacci sequence. These derived numbers include 0.786, 0.886, 1.13, and 1.27. There are also many complementary numbers: 0.382, 0.50, 0.707, 1.41, 2.0, 2.24, 2.618, 3.14, and 3.618. These numbers validate harmonic patterns and determine areas of potential price changes.
How to trade using harmonic patterns
To achieve positive results using harmonic patterns, you will need to:
Remember what different harmonic patterns look like.
Recognize these patterns on a price chart.
Use Fibonacci tools correctly.
Know how to find the targets of harmonic patterns.
The closer a harmonic pattern seen on the chart is to the proportions described for this pattern in textbooks, the higher the probability that it will produce a good trade signal. Note that it’s necessary to wait until the pattern is formed before trading on its signal.
Example of trading
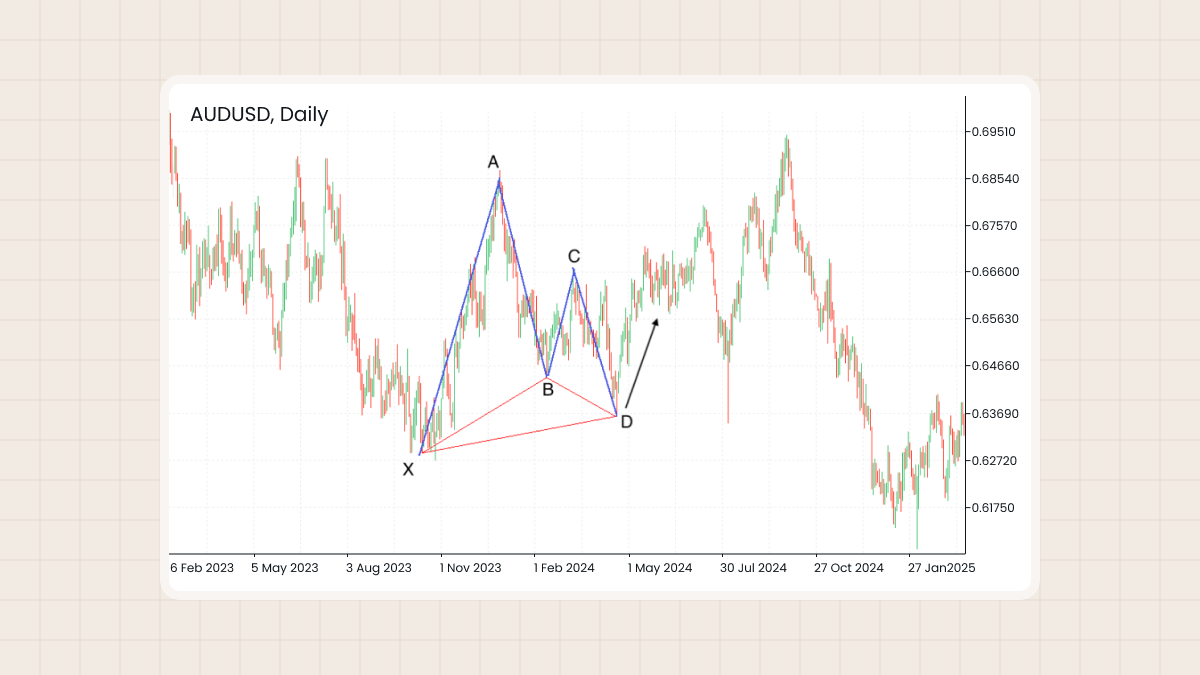
Always wait for the end of the Harmonic pattern’s formation. In this example, we see a Cypher Harmonic pattern formed. Entry into the transaction is only after the formation of point D. It would be ideal to find an additional factor confirming the reversal: for example, a pin-bar, bullish engulfing, divergence on RSI or MACD, etc.
After entering at point D, the price starts to rise. When the targets are reached, we lock in the profit. This example shows how harmonic patterns help to find entry points with high-profit potential if you follow the rules of the strategy.
Summary
Harmonic patterns enable you to identify key price reversal levels based on Fibonacci numbers accurately. They help traders eliminate guesswork and make informed trading decisions. However, to use this technique effectively, you must study the patterns, apply Fibonacci tools correctly, and wait for confirmation before entering a trade.