What is a Doji candle?
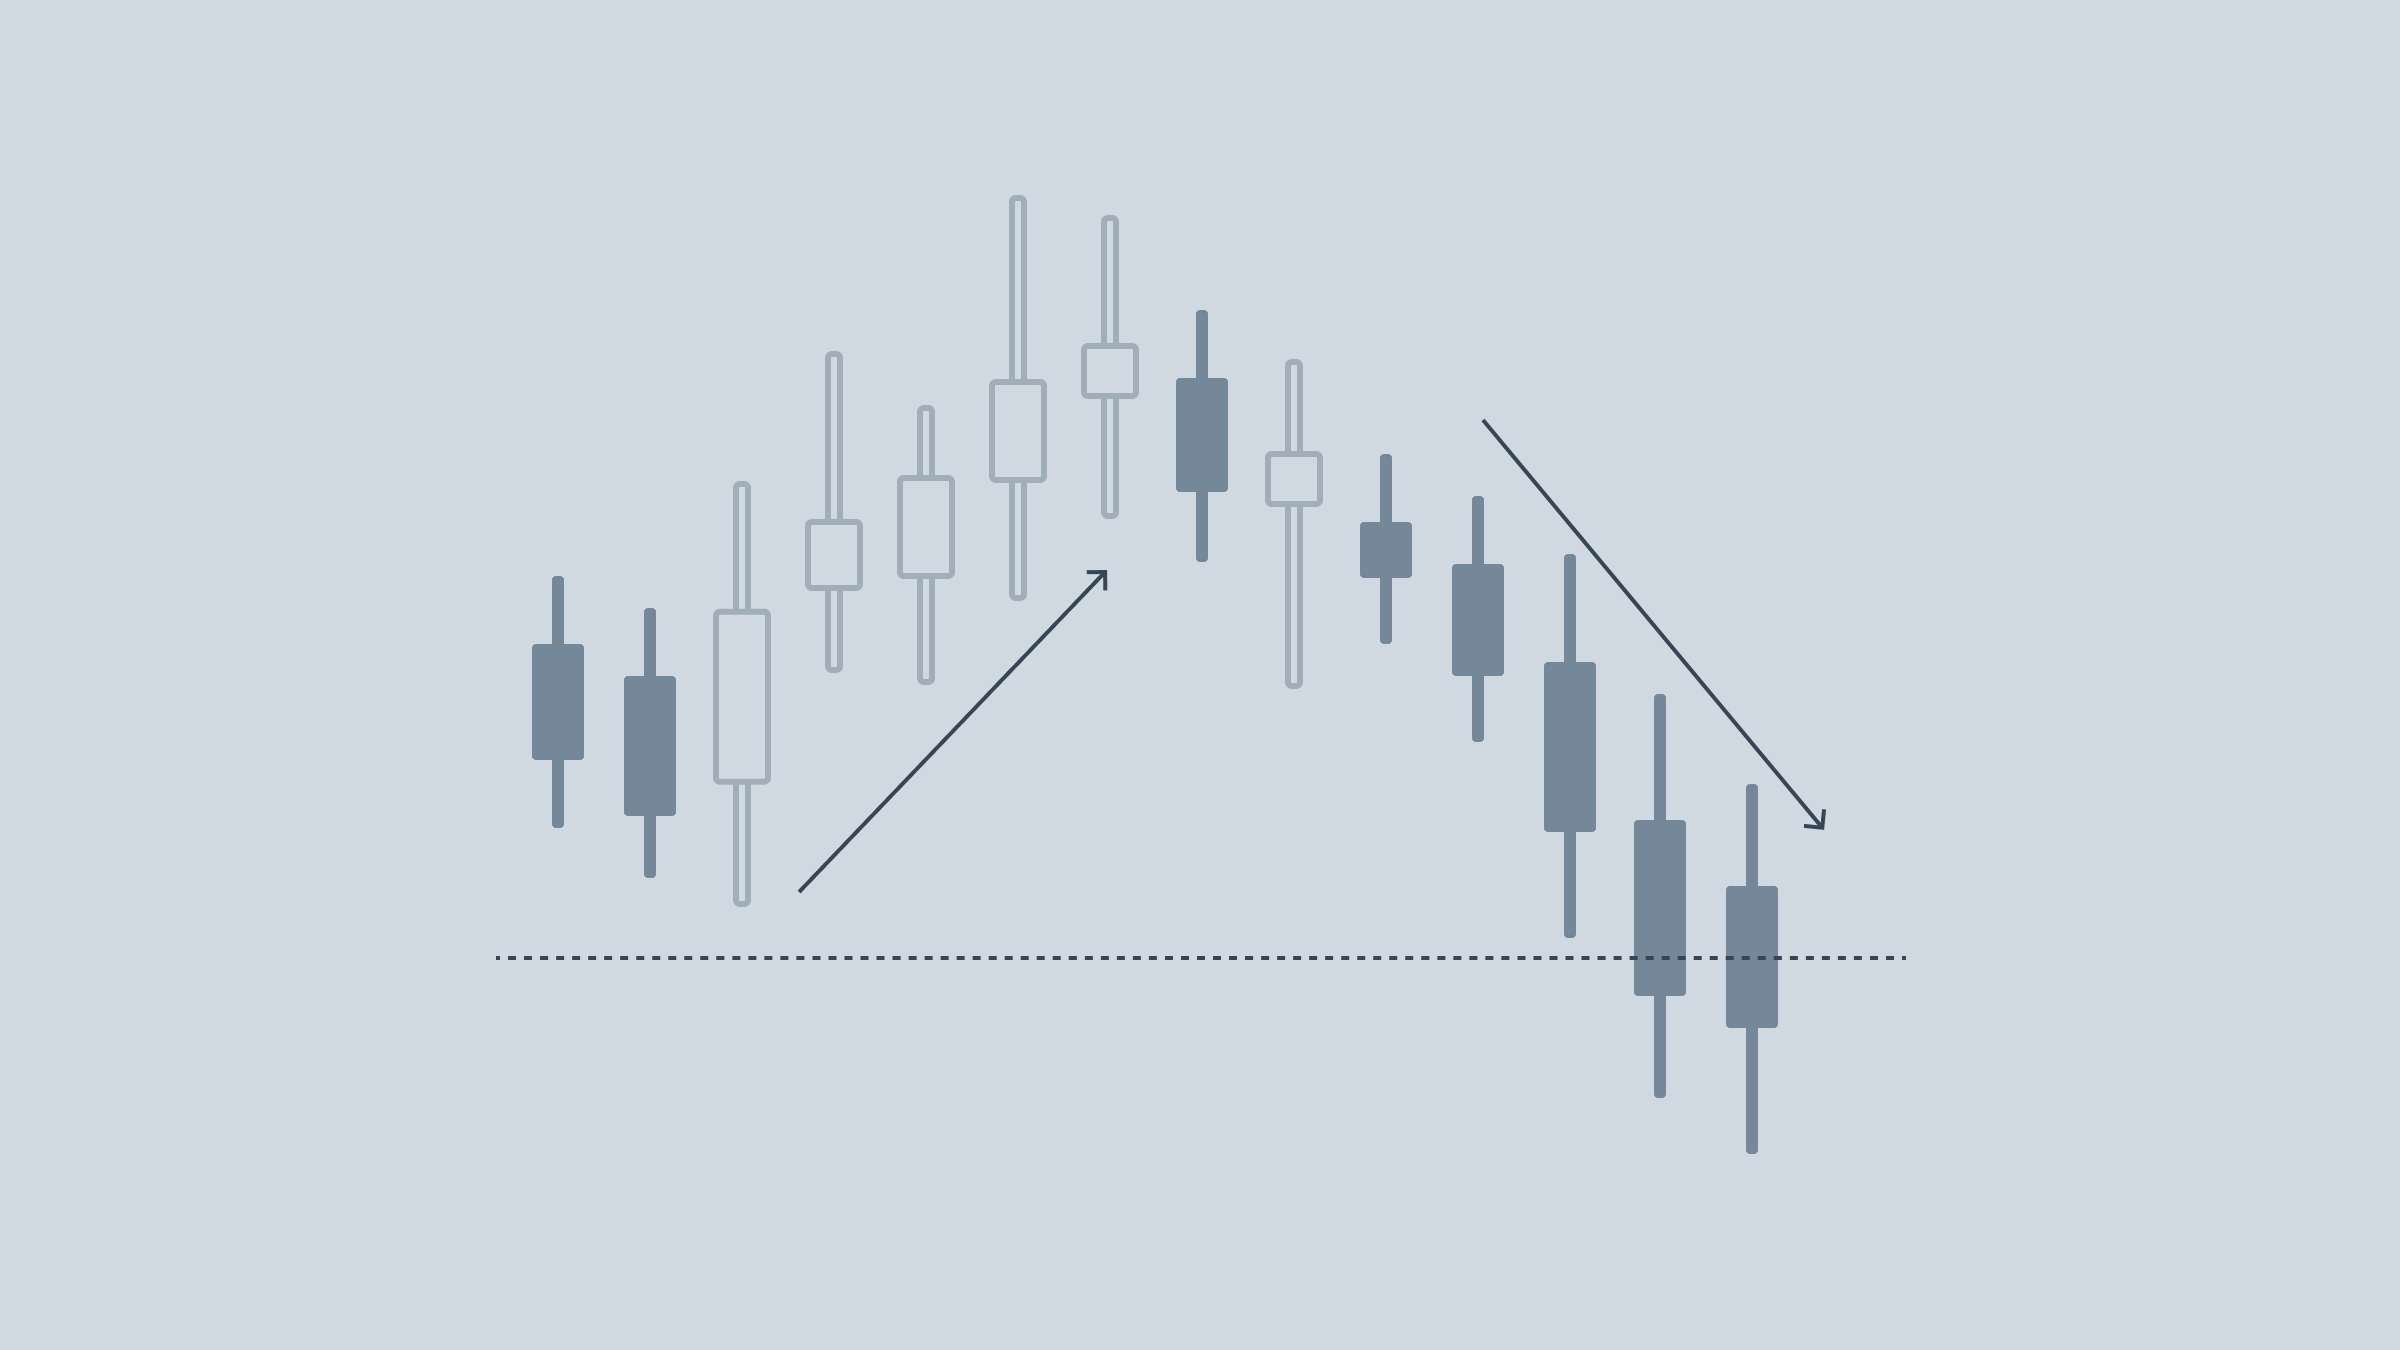
Suppose your asset closes at the same price it opened at. It doesn’t matter what kind of storm und drang was happening in the market that day — even if your asset went on a rollercoaster ride, it still ended up where it started. This activity on a daily timeframe will then be represented by one of a number of types of Doji candle. It might have very long shadows, or not, but it will definitely have almost no body.
What does a Doji candle mean?
It means buyers and sellers ultimately exerted equal force on the price. It’s a stalemate between the two opposing forces.
If the all-shadow, no-body candle appears during a lot of volume, a breakout in one direction or another is inevitable, simply because something’s got to give. If the volume is low, though, that means both sellers and buyers are simply losing interest and the market is consolidating.
A trader will look at a Doji and ask whether it portends a reversal or a continuation. The art of interpreting a Doji’s position in the context of market trends is an invaluable one to master.
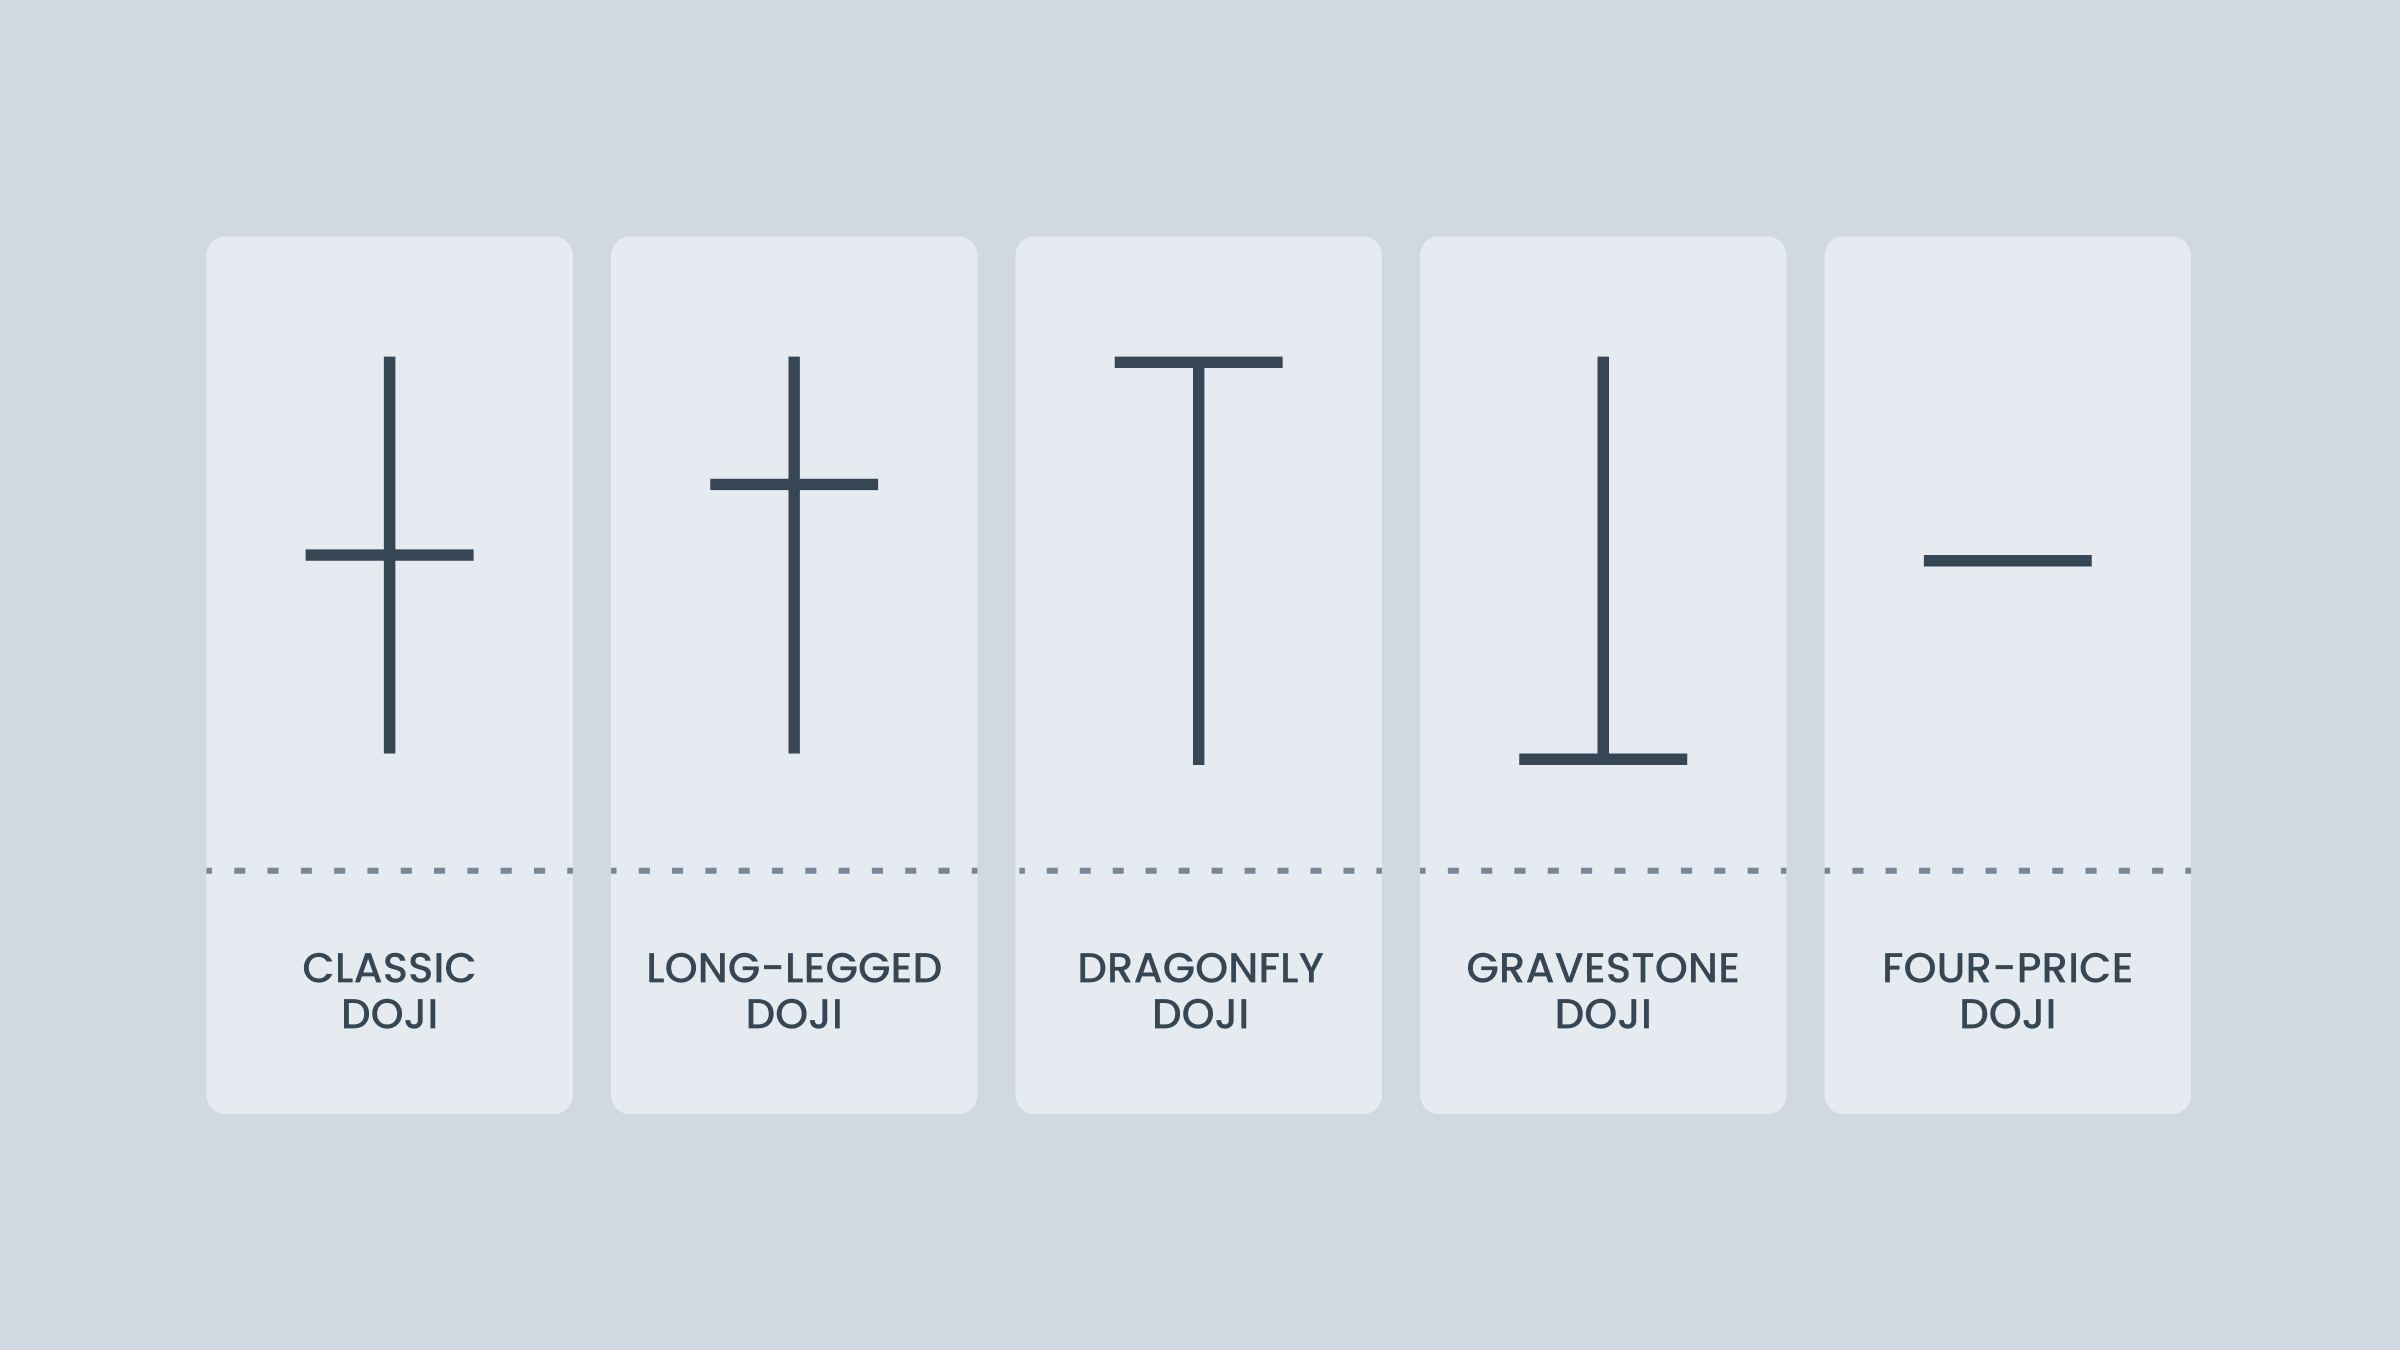
The Doji is a pretty versatile thing. There are five Dojis, and they all show different things about the market.
Classic Doji: The shadows are equal. Consolidation time.
Long-legged Doji (the Rickshaw Man): The shadows in both directions are very long. Buyers and sellers are in a real fight.
Dragonfly Doji: The bottom shadow is long, the top shadow is practically nonexistent. Sellers pushed hard and got the price down at some point during the session, but by the end, it was back where it started.
Gravestone Doji: The mirror image of a Dragonfly - no bottom, and tons of top. Sometimes, this is a good predictor of a bearish reversal.
Four-Price Doji: Equal on all sides. Usually appears at very low-volume parts of the trading session cycle.
Doji patterns
A Doji by itself doesn’t tell us that much. To figure out what it means, you have to look at how it fits in among other candles.
The Rickshaw Man
The Rickshaw Man pattern has a Rickshaw Man Doji in it and means something’s going to break somewhere sometime soon.
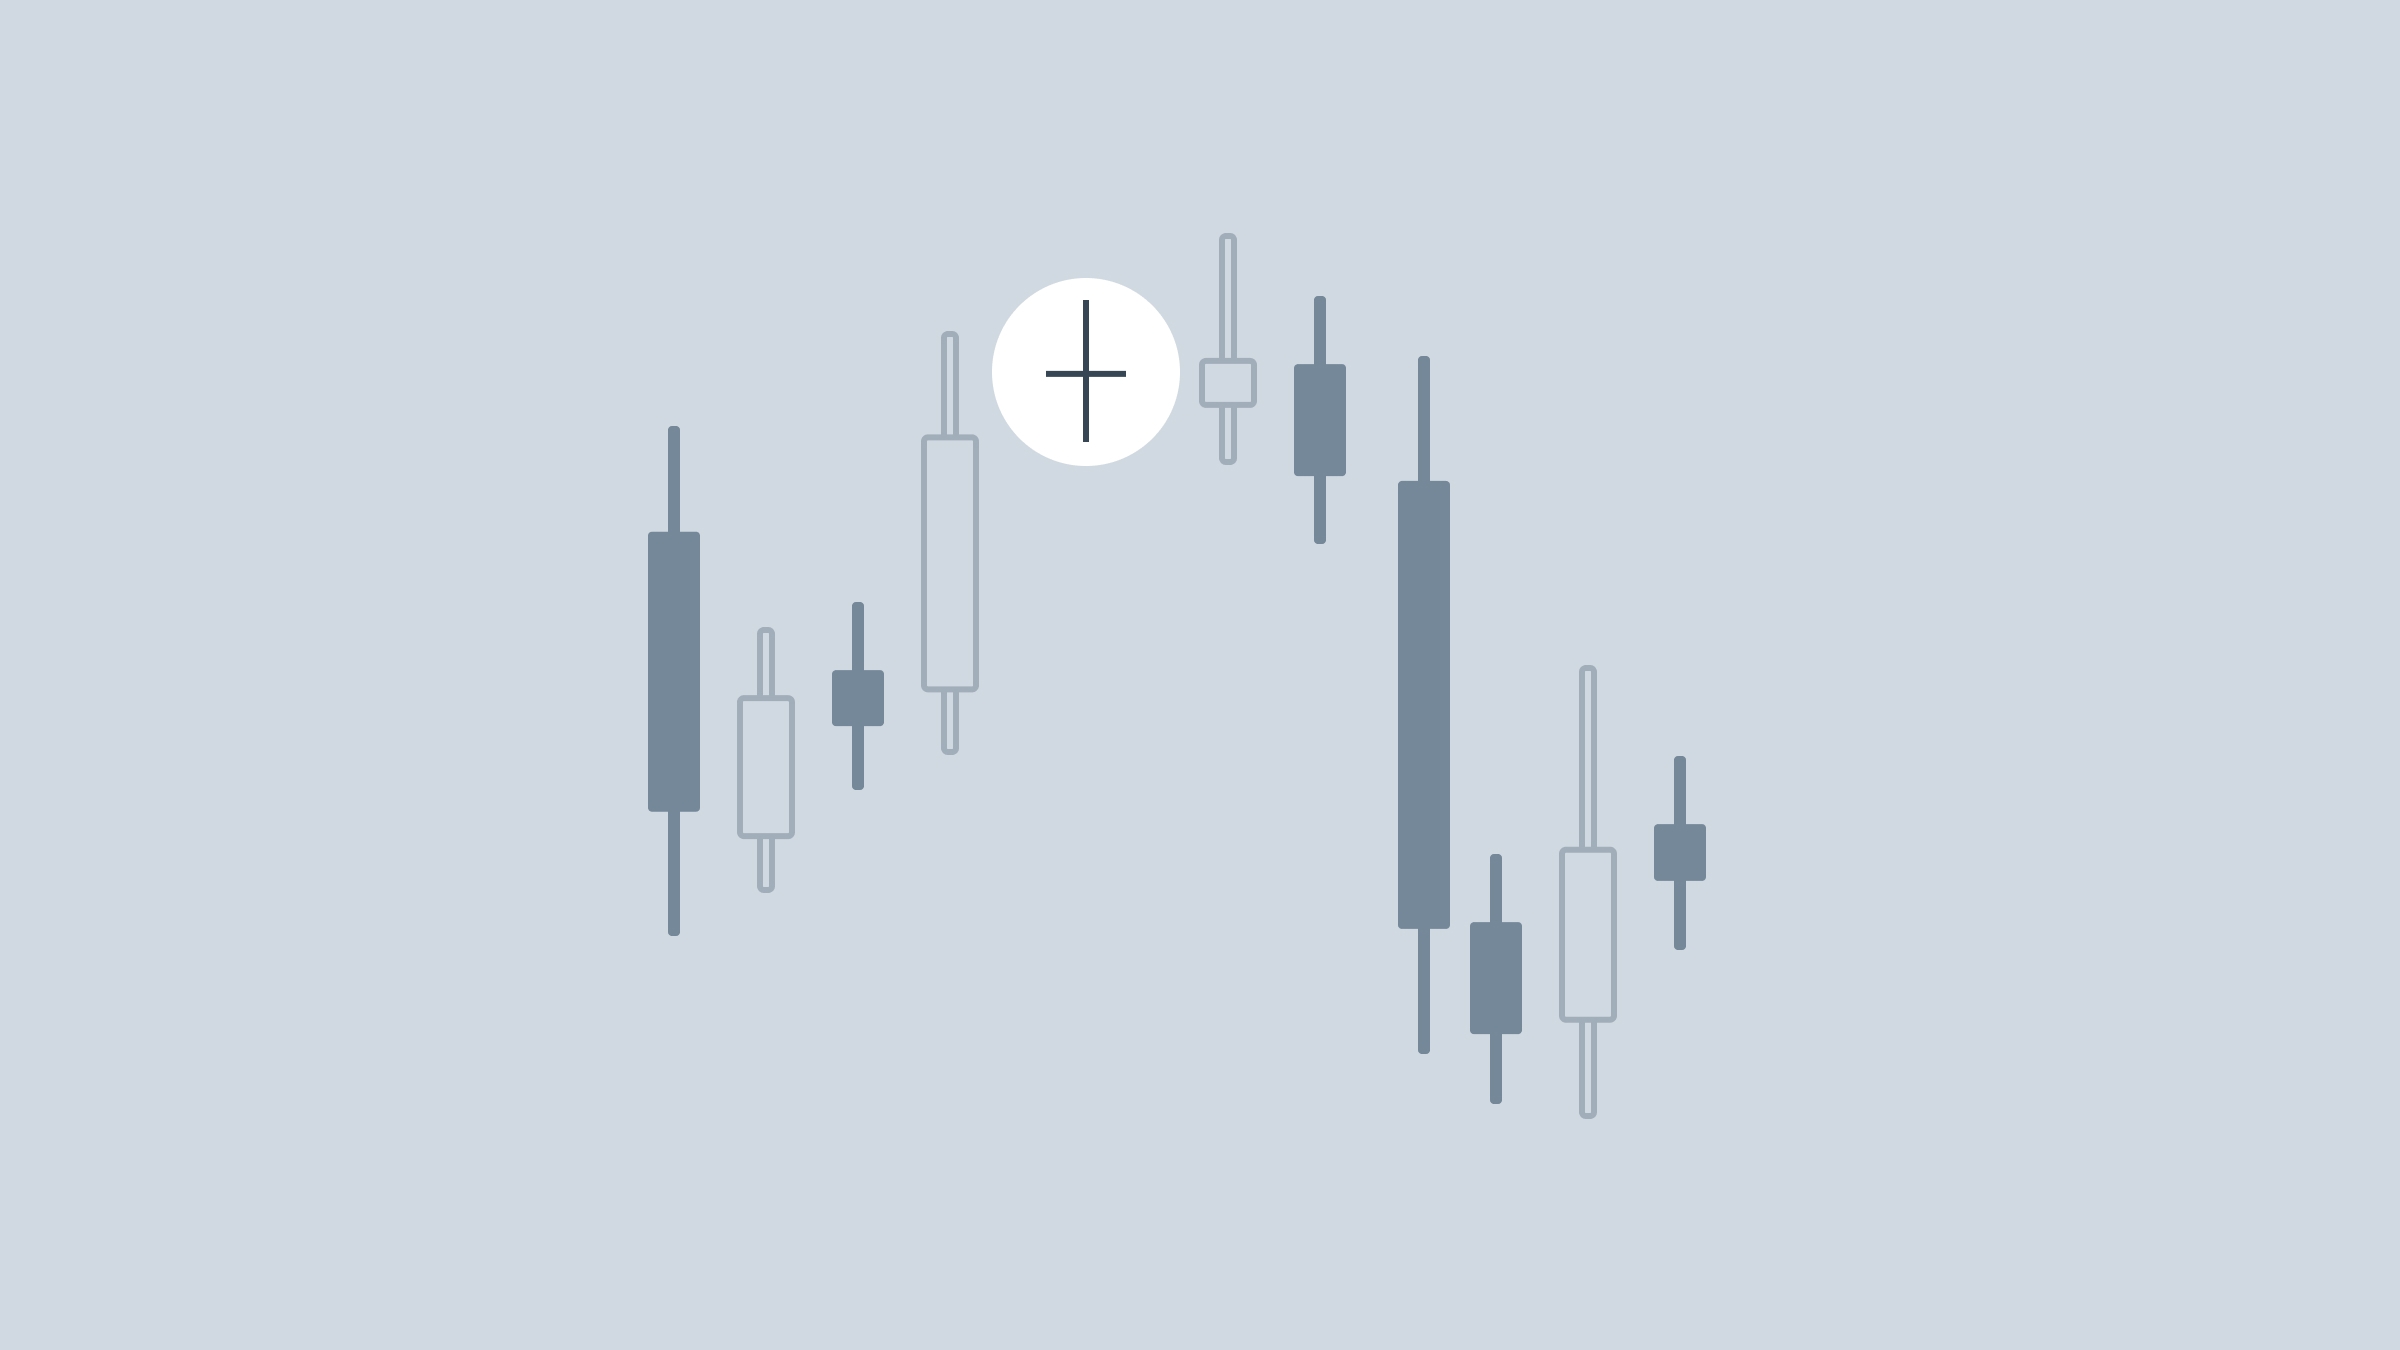
The Harami Cross
A Harami pattern with a Doji for a second candle. There was a strong push in one direction or the other, but that movement immediately ground to a screeching halt. A savvy trader may then anticipate an imminent reversal.
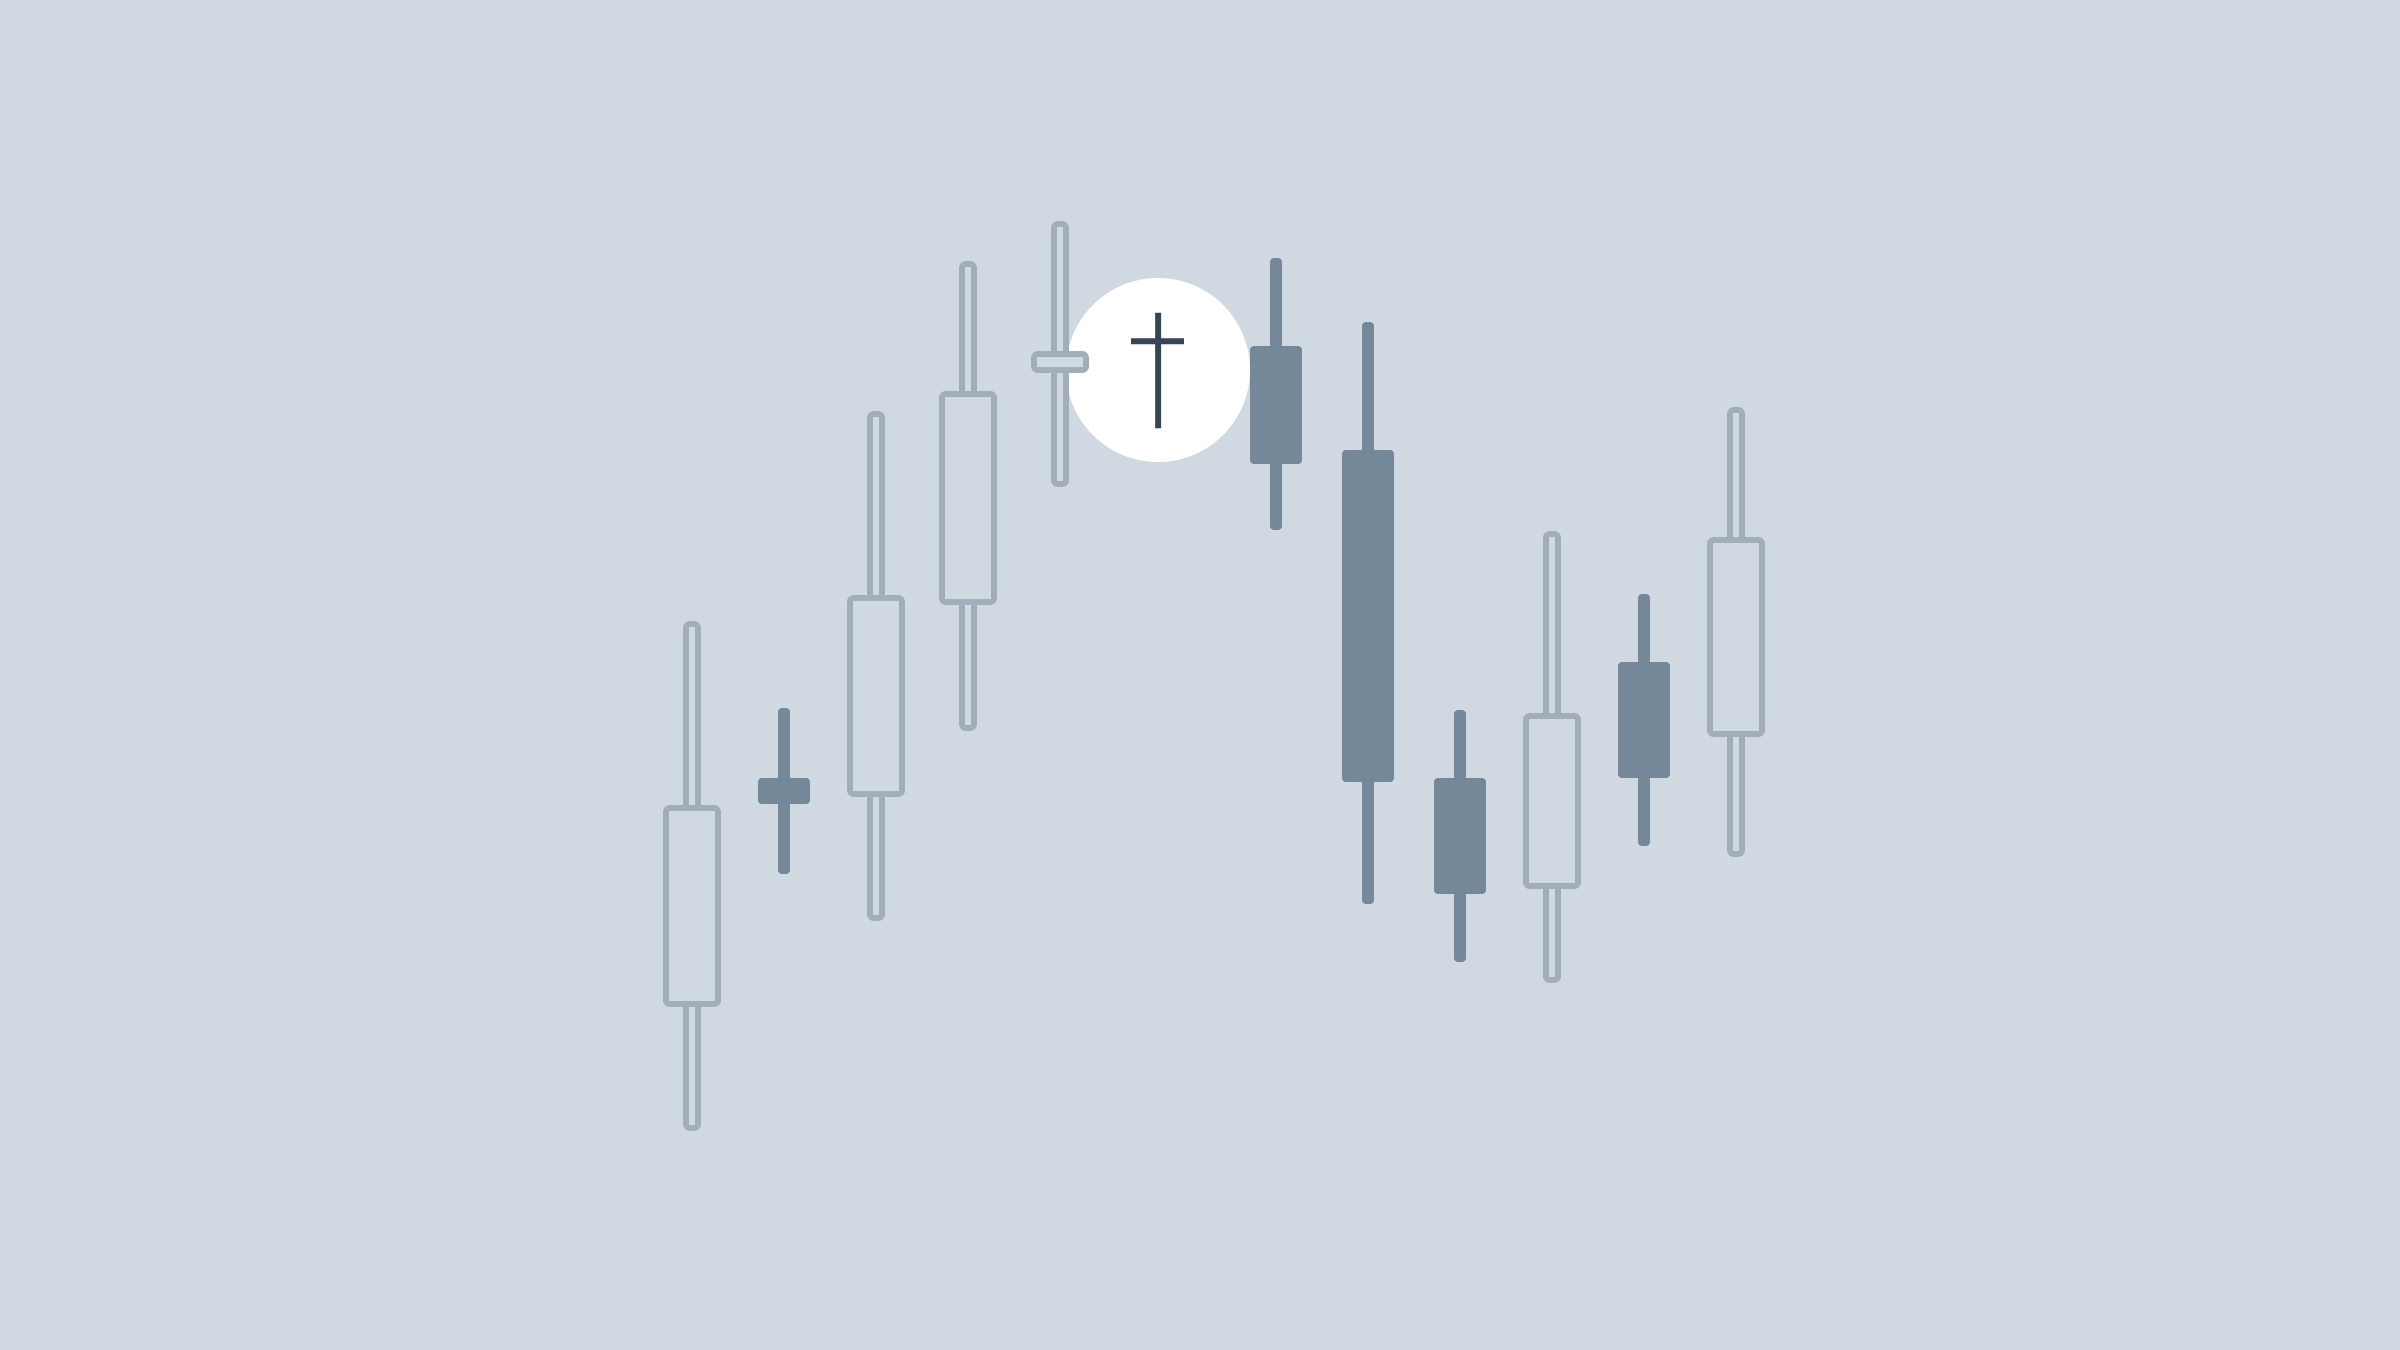
The Morning and Evening Stars
A long candle (bullish if Morning and bearish if Evening), followed by a Doji that is either above, or below the previous candle, respectively, and then followed by a strong candle moving in the opposite direction. These are harbingers of a reversal, or at least a shift in pressure.