Shark pattern was discovered in 2011 by Scott Carney. It is a variation of the more common Gartley, Bat, and Butterfly patterns. The swing points in this pattern are marked with 0, X, A, B, C.
Notice that in such patterns as Gartley, Bat, Crab, Butterfly, the second top in a bullish pattern and the second bottom in a bearish pattern were lower/higher than the first one. In a bullish Shark pattern, however, the second top is higher than the first one. In addition, it combines Fibonacci with Elliott waves theory and some new ratios like 113% are used.
.jpg)
Here are the key parameters of a Shark pattern:
There’s no specific place for A.
Point B is at the 113%-161.8% extension of XA.
Point C is at the 113% extension of 0X and at the 161.8%-224% extension of AB.
How to trade Shark pattern
The approach to trading a Shark pattern is a bit different from that we designed for other patterns. The entry is at 88.6% of 0X. The Take Profit can be at 50%-61.8% of BC. The Stop Loss should be at the point C.
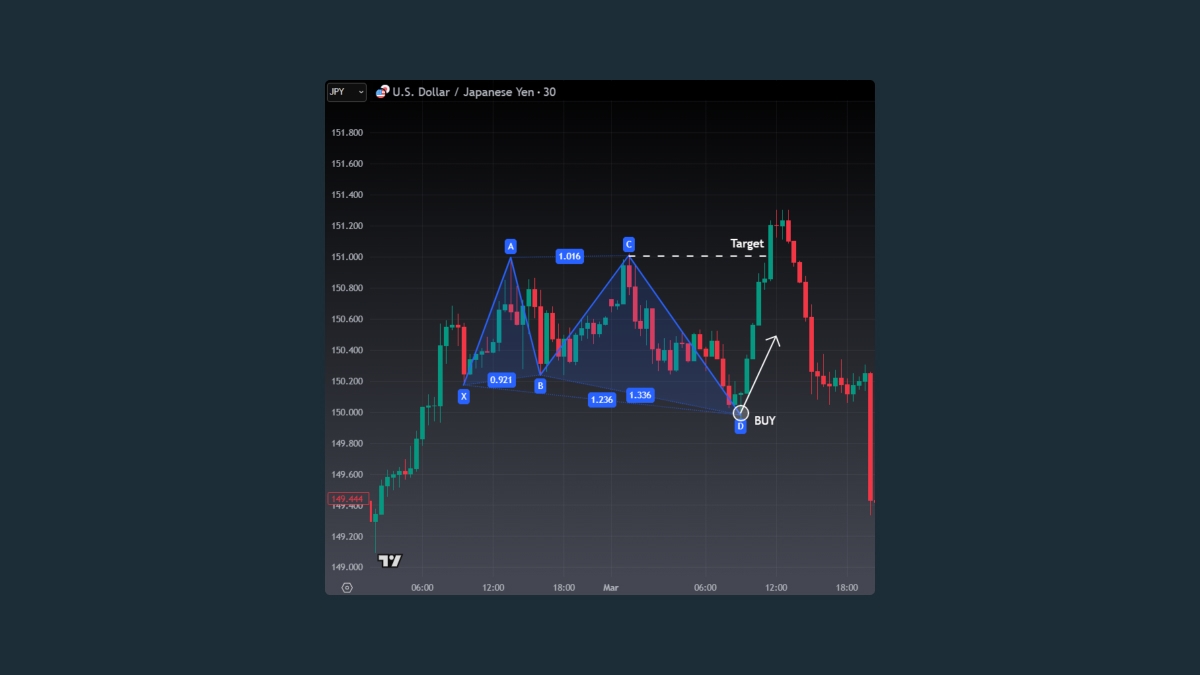
Here’s how a bullish Shark pattern looks like on the chart. The point B is at the 113% extension of XA. The point C is near the 113% extension of 0X. The entry to a buy trade is at the 88.6% retracement of 0X. The Stop Loss is at the point C.