The price chart doesn't move in a straight line. Even if the price has a certain trend, it usually makes a lot of small moves back and forth. These moves occur naturally as large positions are opened and closed on the interbank market.
When you open a trade, ideally, your position quickly moves to profit. However, random fluctuations of the price — so-called noise — can lead you to a drawdown, and even prematurely trigger your stop-loss. In addition, market noise can also give you false trading signals.
A trader always aims to make the most precise entry in the market: one that fits the “buy low, sell high” principle and is not followed by a drawdown. To achieve this goal, it’s necessary to understand how to deal with market noise.
1. Timeframes
If you look at a higher timeframe (for example, D1), you probably won’t see many of the price moves that can be observed on a lower timeframe (H1). As a result, if you see that smaller timeframes and intraday trading aren’t your cup of tea, consider switching to higher timeframes and increasing the period of your trades.
2. Focus on trends
Trend trading is one of the most rational approaches to the Forex market. In trend trading, minor corrections inside a trend and intraday volatility are considered market noise.
To reduce your exposure to market noise, do the following:
Determine the direction of a trend. You are free to use techniques like trendlines, moving averages, and other trend indicators.
Measure the strength of this trend. You can read up on how to use the most popular technical indicator to measure a trend’s strength, which is ADX.
Use special indicators that eliminate market noise. Below, we list the best tools to help you avoid the false movements of the price.
Choose a trading strategy. You may decide to trade on price action; combine Heiken Ashi with ADX; use ZigZag together with Bollinger Bands; or go with Alexander Elder’s triple screen system that filters out signals through the use of multiple timeframes. There are many options to choose from! The main thing is to make sure that you use at least some tool to eliminate the market noise in your system.
3. Technical tools that help eliminate price noise
There’s a number of technical indicators and tools that are designed to help traders disregard the false movements of the market and focus on the big swings that can offer good profits.
4. The Zigzag
The Zigzag is an indicator that marks significant price swings on a chart. Smaller fluctuations that are below the indicator’s sensitivity threshold are not highlighted. Thus, the Zigzag helps traders to see the general picture and make decisions on the basis of the true price dynamics. Here’s special guidance for setting up the Zigzag on your charts.
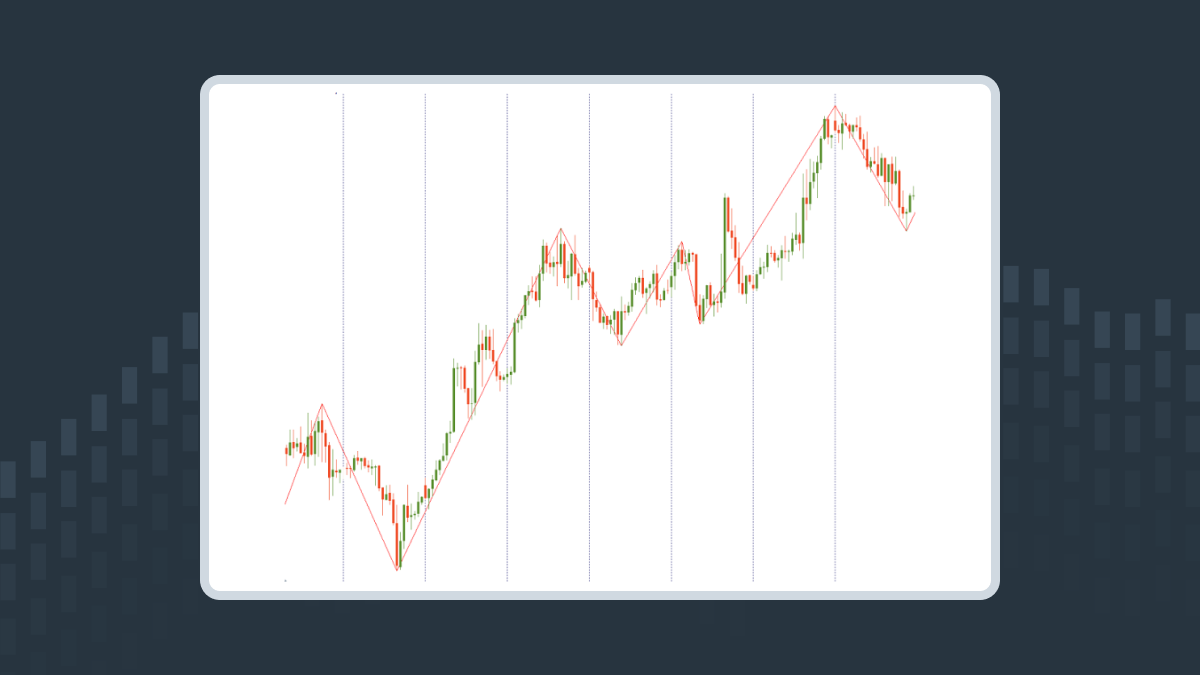
The Zigzag is highlighting only the most important price swings
5. The Heiken Ashi
The Heiken Ashi is a custom technical indicator that provides traders with a whole new type of price chart. The indicator draws candlesticks that have a formula different from traditional Japanese candlesticks. In particular, open and close prices are recalculated on the basis of averages. This tweak allows traders to disregard market noise and get specific signals about a trend’s strength.
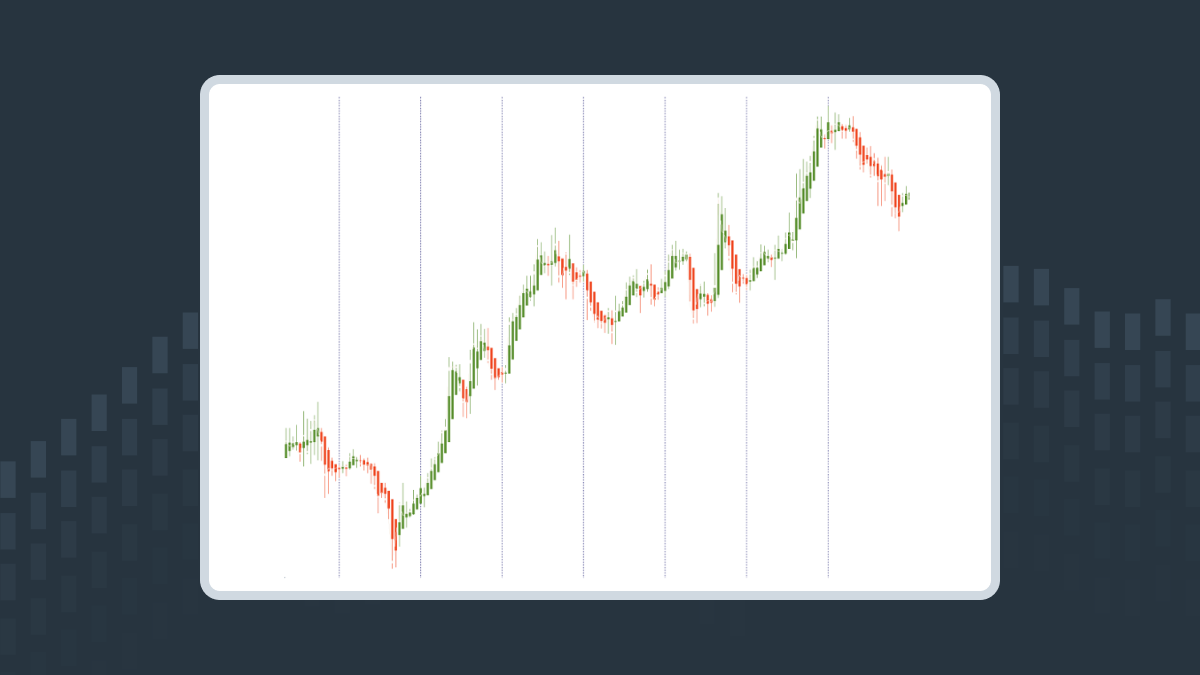
The Heiken Ashi redraws Japanese candlesticks and smoothes the chart
6. The Renko chart
Renko is another alternative to the simple Japanese candlesticks chart. Its special feature is that it doesn’t take into account parameters like time. A ‘brick’ appears on the Renko chart only when the price covers a certain distance up or down. As a result, a trader gets a unique opportunity to study the market from the point of the price's direction. The ability to choose the brick size allows the analyst to filter out small, insignificant fluctuations.
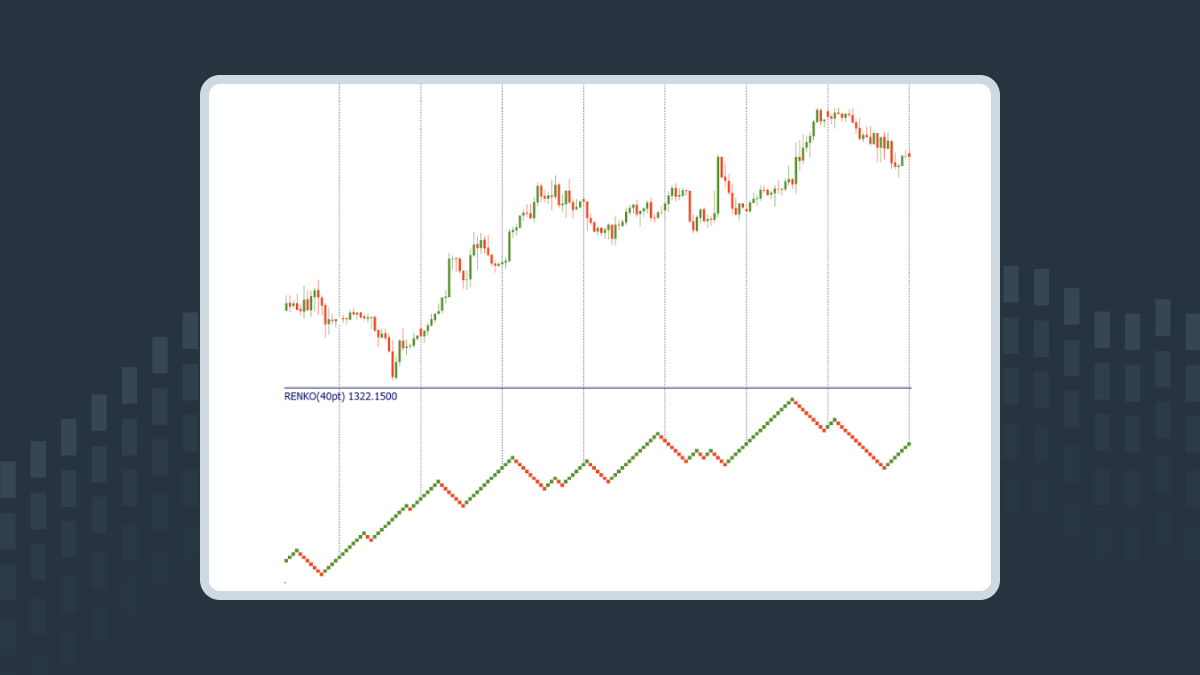
The Renko chart provides unique insights into price movements
7. Moving Averages
Moving Averages (MAs) are another effective tool for smoothing out price fluctuations and reducing market noise. By averaging the price over a specific period, MAs help filter out short-term volatility and highlight the underlying trend. A common approach is to observe the price position relative to the MA: if the price is below the MA, the market is generally considered bullish; if it is above the MA, it suggests a bearish trend. The trader should choose the period of the MA based on their preferred timeframe and comfort level. The most commonly used MAs are the 50-period, 100-period, and 200-period MAs, which are often relied upon to indicate the overall trend direction.
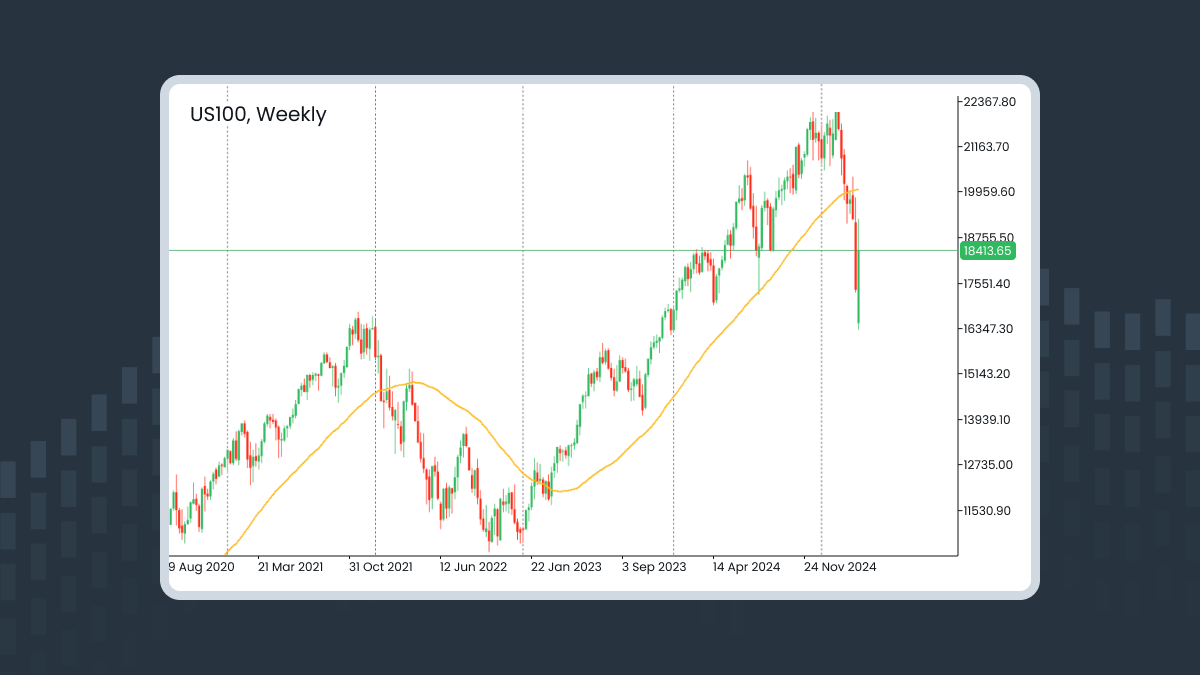
The 50-MA indicates the beginning of a bearish trend for the US100 when the price broke downward through it.
Summary
Dealing with market noise is an inevitable part of Forex trading. By being aware of this phenomenon, you will be able to avoid trading mistakes and improve the profitability of your trading strategy.