Here is how the pattern looks like:
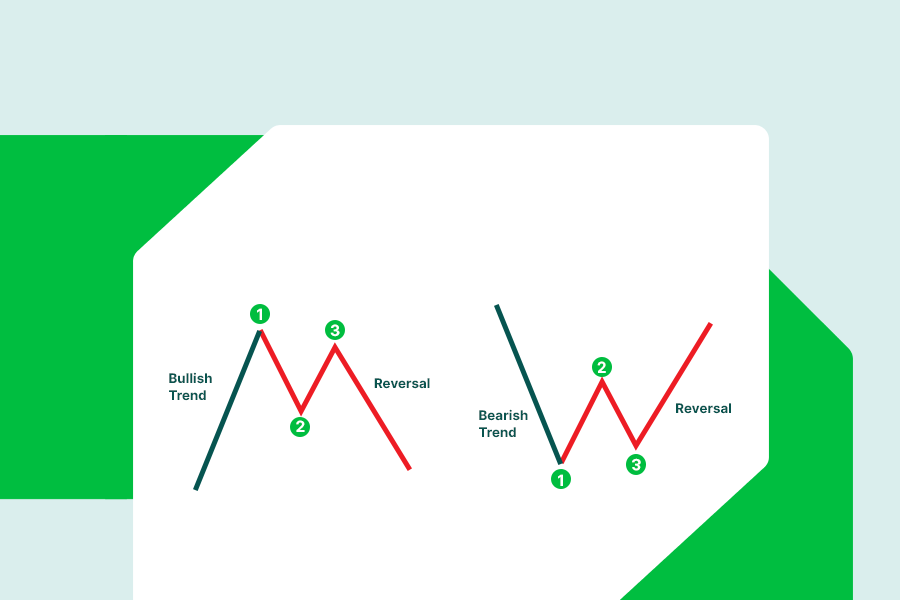
The 123 pattern works in both directions. In the first case, a bullish trend turns into a bearish one. The second picture presents the opposite: a bearish trend turns into a bullish one.
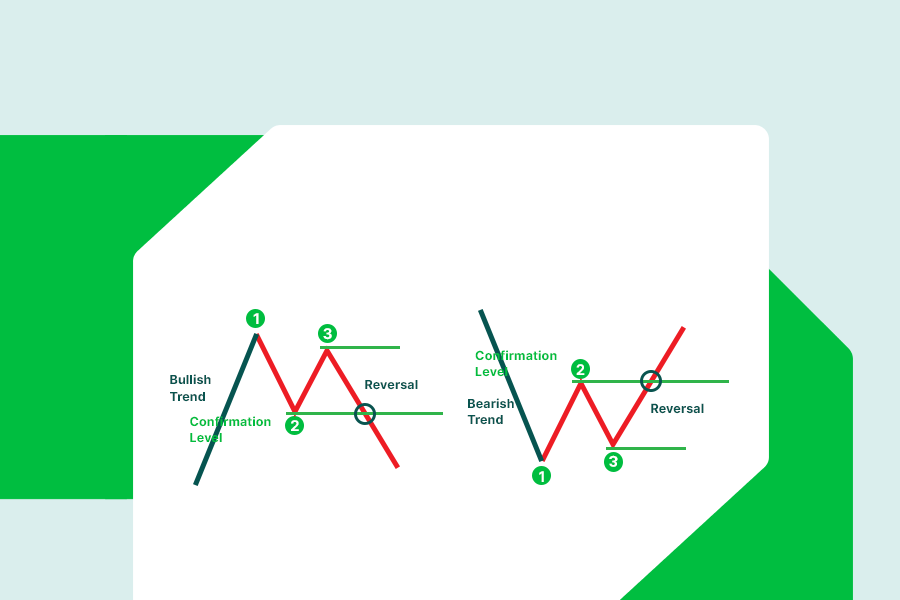
The structure of 123 chart pattern
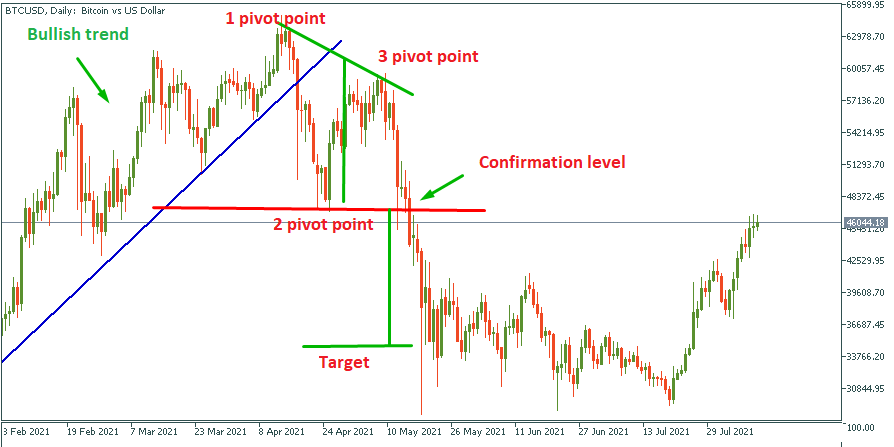
The pattern appears after three price movements, which form three pivot points and a confirmation level.
Pivot point 1.
This is a turning point that the price formed during the trend. If a price breaks the previous trendline after it formed pivot point 1, the pattern will be more reliable.
Pivot point 2.
The next turning point is very likely to form outside of the previous trendline or channel. This is a good indication that the trend might be ready to end and reverse.
Pivot point 3.
Pivot point 3 is crucial for 123 reversal chart patterns. The point must not exceed the pivot point 1 (in the worst case it might be on the same level) for the pattern to be valid.
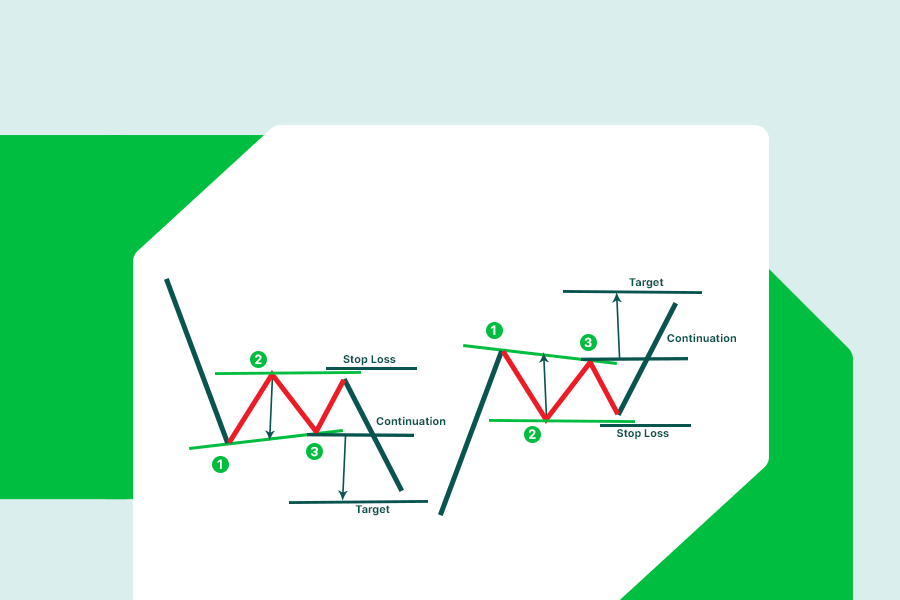
Confirmation level
The confirmation level is our entry point in the market. It is located at the same level as pivot point 2. When the price breaks through this level open the trade.
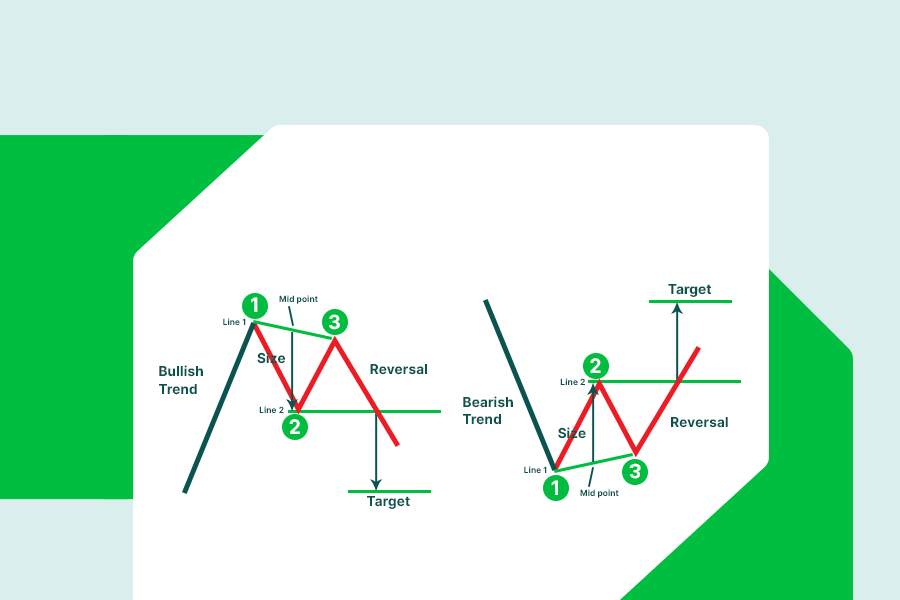
Target level
To set the target trader needs to connect 1 and 3 pivot points with a line. The size of your 123 pattern equals the vertical distance between Line 2 (which is a horizontal line at the level of 2 pivot points) and the midpoint of Line 1.
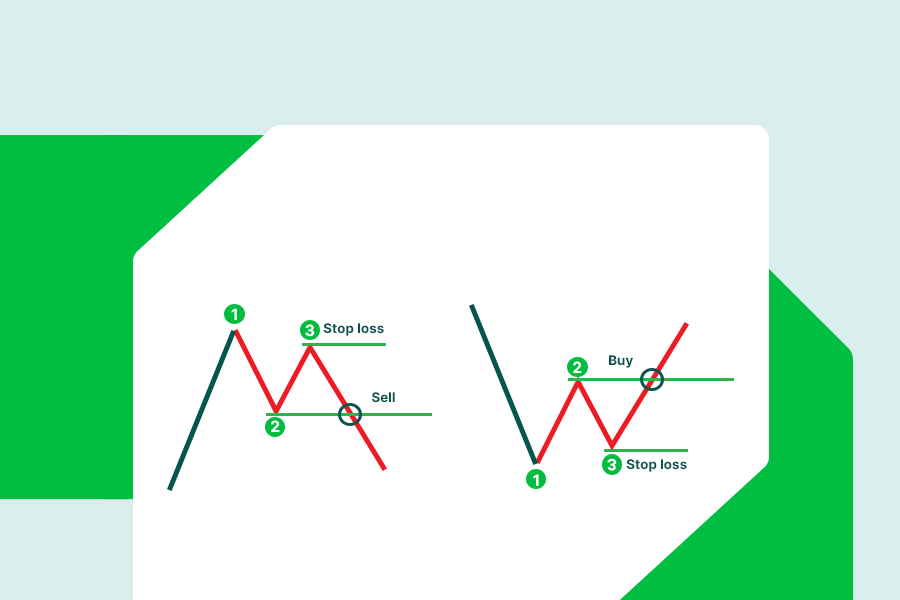
123 chart pattern stop loss setup
It is highly important to use Stop loss when trading the 123 chart pattern. The Stop loss should be set under pivot point 3 in the bullish trend reversal, and above in the bearish one. In the condition of high market volatility, the price might get pushed beyond the 2 pivot point for a while. That’s why it will be a good idea to set Stop loss slightly beyond the 3 pivot point, as this will prevent Stop loss from being activated.
If you're not sure how to set it up or want to explore smart trading strategies from the start, check out the FBS video tutorial. Learn how to open your first trade and choose the best trading strategy for confident trading.