.jpg)
The Elliott Wave Theory (also sometimes referred to as the Elliott Wave Principle) is a popular and powerful tool traders and analysts use in financial markets to predict future price movements. Ralph Nelson Elliott developed the theory back in the 1930s. The theory is based on the concept that financial markets follow a repetitive and predictable cycle of waves driven by the collective psychology of market players. Interestingly, Ralph Nelson studied hourly and 30-minute charts for various indices that covered a period of 75 years.
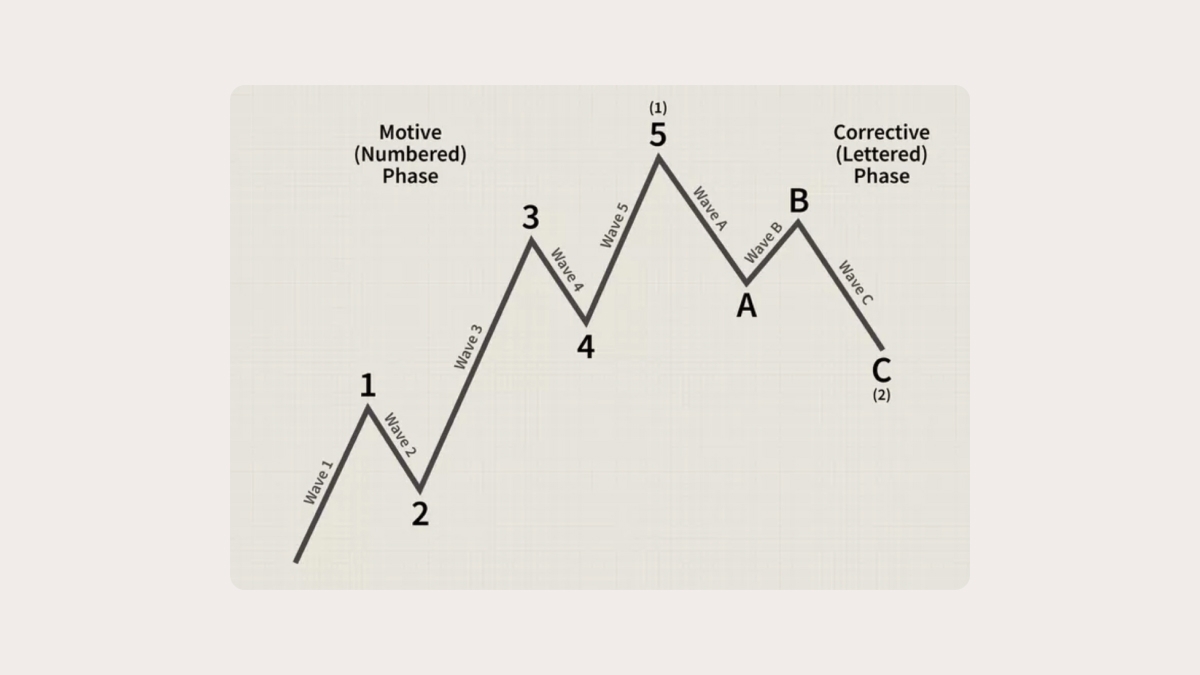
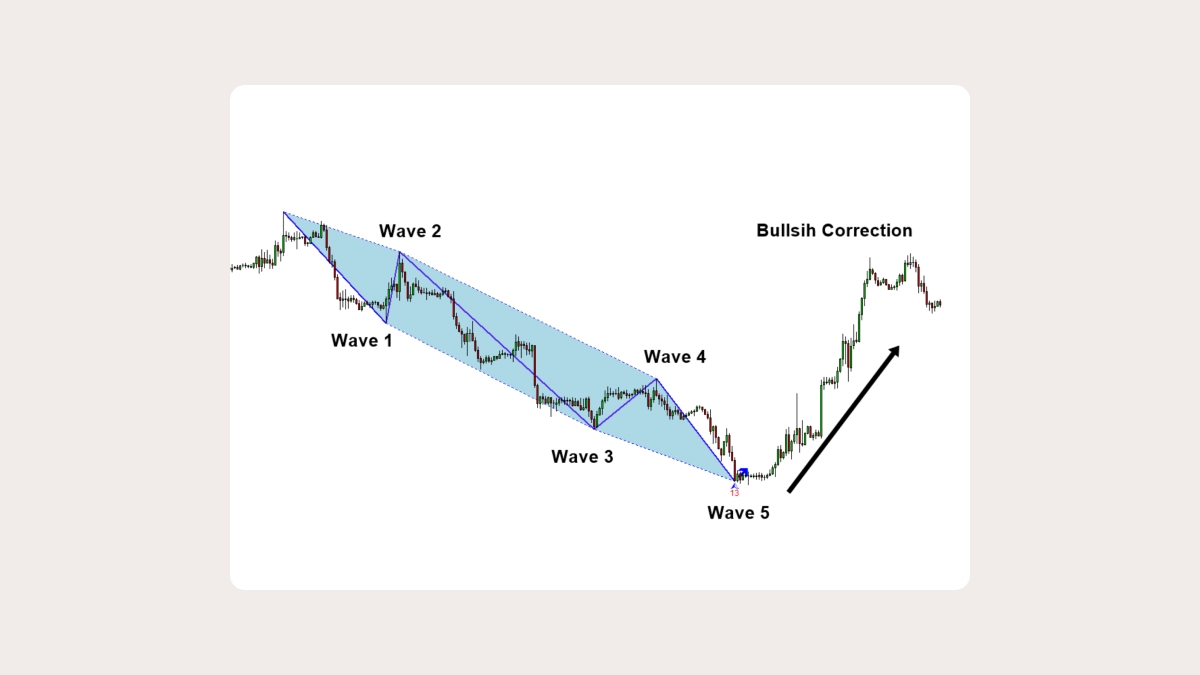
According to his theory, markets move in a series of five waves in the direction of the primary trend, followed by three corrective waves. These waves often repeat in a fractal pattern, meaning that the waves occur at different timeframes on multiple scales.
If you understand the basics of the Elliott Wave Theory, you can anticipate market trends, identify entry and exit points for your trades, and build more effective market strategies.
Key components of the Elliott Wave Theory
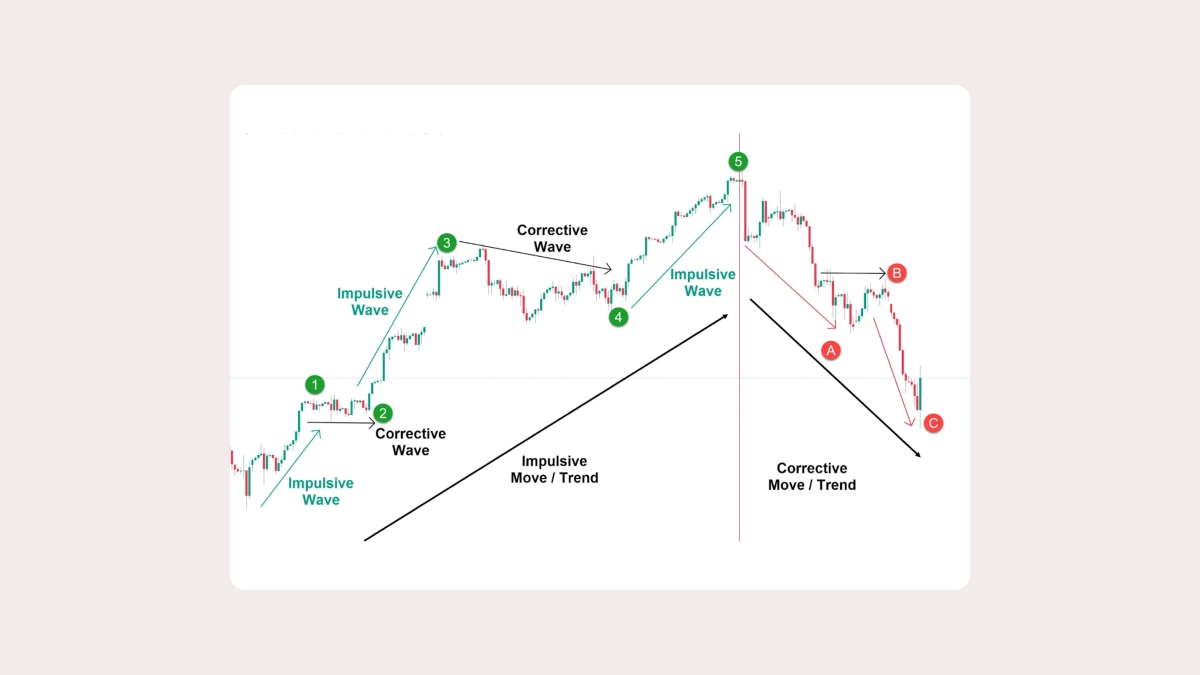
Impulse waves (the motive or trend waves)
The five waves that move in the direction of the primary trend are called impulse waves, from wave 1 to wave 5:
The initial move in the direction of the primary trend.
A corrective wave that typically retraces a portion of wave 1 but doesn’t go beyond the starting point of wave 1.
The longest and the most powerful wave, moving intensely in the direction of the trend.
A corrective wave, typically less intense than wave 2, that doesn’t overlap with wave 1.
The final move in the trend wave signals the peak or exhaustion point.
Corrective waves (moving against the trend)
After the five impulse waves, the market enters a corrective phase, where the trend temporarily reverses. This corrective phase includes three waves, labeled A, B, and C:
A. The initial move against the primary trend.
B. A corrective wave that retraces part of wave A but doesn’t exceed its peak.
C. The final leg of the corrective phase, typically the most powerful, moves vigorously in the opposite direction of the trend.
Basic rules of the Elliott Wave Theory
Conveniently, the Elliott Wave Theory offers a few primary rules the markets follow. These rules help identify the structure of waves and understand the difference between impulse and corrective waves.
Since the rules describe specific mechanisms, they can be used to understand the price direction for the near future and act accordingly. Here are the essential rules:
Wave 2 can never go beyond the start of wave 1.
Wave 3 is never the shortest of waves 1, 3, and 5.
Wave 4 cannot overlap with the price territory of wave 1.
Wave 5 should end with momentum divergence.
Pros and сons of the Elliott Wave Theory
Pros:
Predictive power
The wave patterns often forecast market movements rather reliably.Fractal nature
The theory can be applied to any timeframe, providing insight at various levels.Comprehensive framework
The theory combines technical analysis with market psychology, making it versatile.
Cons:
Subjectivity
Wave counting can be prone to human error, and traders may interpret waves differently.Complexity
Mastering the Elliott Wave Theory requires market skills, experience, and extensive practice.Dimmed future
Unfortunately, while Elliott waves are well observed for past periods, they are much more opaque in the future, making practical use of the Elliott Wave theory difficult and requiring special knowledge.
How to use the Elliott Wave Theory in trading
Any theory becomes well-known and truly appreciated when used for practical purposes like trading. How can you use the Elliot Wave Theory in your trading routine?
Identify market trends
If you can identify the pattern with five impulse and three corrective waves, you can determine the prevailing market trend. Hence, you can understand the market condition: uptrend, downtrend, or sideways.Spot entry and exit points
The theory lets traders enter the market at appropriate moments:
- At the beginning of wave 3 (the strongest impulse wave)
- During wave C (the strongest corrective wave).
If you want to plan your exits, consider the end of wave 5 and wave C, when the market is expected to reverse.Analyze timeframes
Elliott waves are fractal, i.e. they appear at different timeframes. A trader can analyze waves for a short period (e.g. on a 5-minute or hourly chart) and identify the same wave patterns on a longer-term chart (daily or weekly). That means you can trade according to shorter-term market movements and still understand the context of a larger trend. And your positions may be different: you may have a long-term bearish outlook with a short-term bullish position.Confirm with other indicators
The Elliott Wave Theory works best when combined with other technical indicators, such as moving averages, oscillators (RSI, MACD), and trendlines. These tools can confirm the wave count and provide additional signals for entry and exit points.Manage your risks
Any trader knows that some market movements can be impossible to predict. Hence, it is crucial to have a risk management strategy in place. When you apply the Elliot Wave Theory, you can open stop-loss orders below wave 2 or above wave 4 to minimize potential losses if the market moves against your position.
Using Elliott Wave Theory in MT5
Here is your step-by-step guide on using Elliott waves in MetaTrader 5.
Log in to your trading account in MT5.
Select the chart for an instrument you are interested in.
In the top menu, click Insert.
Hover over Objects and select Elliott.
Choose which wave you want to apply to the chart: Motive (impulse) or Corrective.
Select the points on the chart that you want to be on your wave.
Summary
The Elliott Wave Theory is a valuable technical analysis tool for traders looking to understand and anticipate market movements. When you learn to identify the five-wave structure of trends and the three-wave corrective phase, you will be able to understand where the market will go next.
However, to be able to apply the theory in your real life trading, you will need a lot of experience and a strong understanding of how markets behave. If you add other technical analysis tools, the Elliott Wave Theory will significantly enhance your ability to predict price movements and make informed decisions.
Frequently asked questions
What is the Elliott Wave Theory?
The Elliott Wave Theory stipulates that prices in financial markets move in a series of five impulse waves followed by three corrective waves. These waves repeat for different timeframes and can be used to predict the price direction for the future.
How reliable is the Elliott Wave Theory in trading?
If you understand the Elliott Wave Theory, you will be able to see trends for the instruments you are interested in, enter and exit the market at the right point, and improve your trading results.
However, you will need to accumulate significant market experience and polish your trading skills to be able to actually use the theory in practice. Besides, the Elliott waves are better visible for the past periods, while they may be dimmed for the future. This means that you will need to combine the Elliott waves with other technical indicators to improve the reliability of the predictions.
What are the advantages of the Elliott Wave Theory?
The Elliott waves are valuable in forecasting market movements with high reliability when you know how to identify them. Since the theory works for various timeframes, you can use it for both short and longer periods. The combination of technical analysis with traders’ psychology makes the theory a versatile tool that will work in many situations. However, usually only experienced traders can use the Elliott Wave Theory with the required efficiency, so you may need to invest significant time to master it.