How to calculate the McClellan Oscillator
The MO is calculated in three steps:
First, you find the simple average for the number of advancing and declining issues. These are the prior day EMA values for the 19- and 39-day EMA.
Next, calculate the 19- and 39-day EMAs using the formulas mentioned in the article.
And finally, subtract the 39-day EMA from the value of the 19-day EMA.
The formula for the McClellan Oscillator
Subtract the 39-day EMA from the 19-day EMA. The EMA is calculated by determining the difference between advancing and declining issues. Simplified into one formula, the calculation looks like this:
(19-day EMA of Advances − Declines) − (39-day EMA of Advances − Declines)
To calculate the 19-day EMA, use the following formula:
(Current Day Advances − Declines) x 0.10 + Prior Day EMA
And to calculate the 39-day EMA, use:
(Current Day Advances − Declines) x 0.05 + Prior Day EMA
To compare values over longer periods, use the adjusted formula:
(19-day EMA of ANA) − (39-day EMA of ANA)
ANA stands for the adjusted net advances and is determined by:
Advances − Declines
⎯⎯⎯⎯⎯⎯⎯⎯⎯⎯⎯⎯⎯⎯⎯⎯⎯
Advances + Declines
To calculate 19- and 39-day EMA for the adjusted formula, use the following:
(Current Day ANA − Prior Day EMA) x 0.10 + Prior Day EMA
(Current Day ANA − Prior Day EMA) x 0.05 + Prior Day EMA
How to trade with the McClellan Oscillator
Like most technical analysis indicators, the MO’s use extends to different areas. There are different ways to use it to predict future prices.
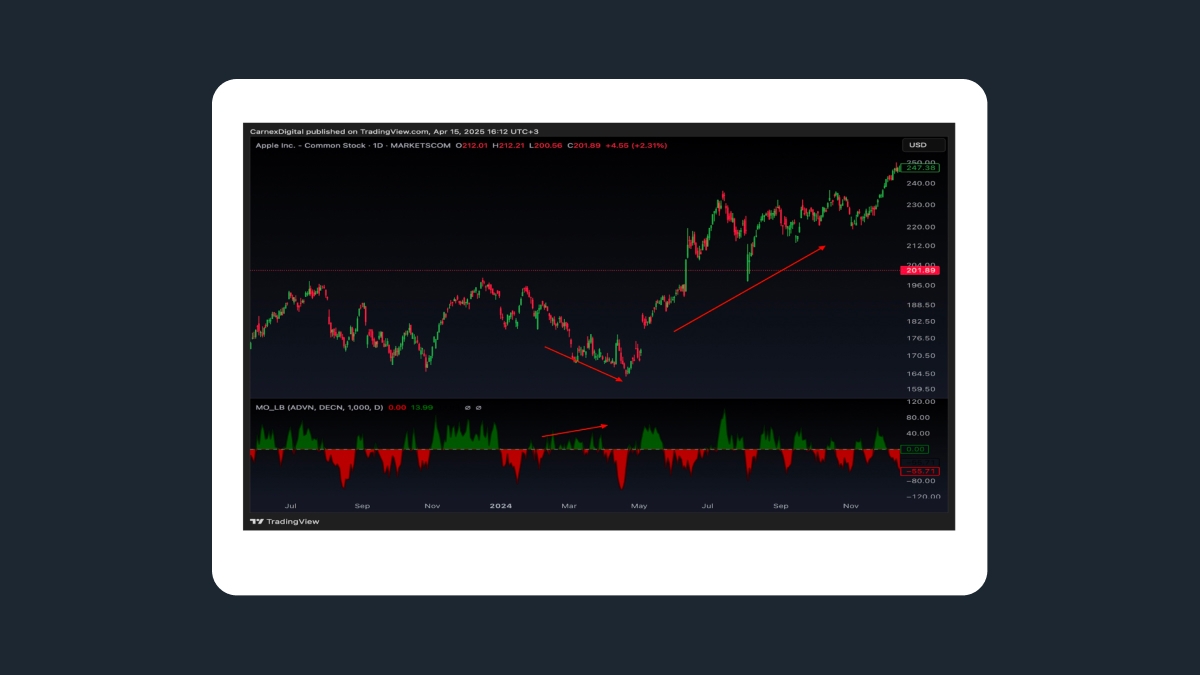
This indicator can give specific buy or sell signals. The most popular application is to analyze bullish or bearish divergence. Divergence occurs when the indicator moves in the opposite direction from the price.
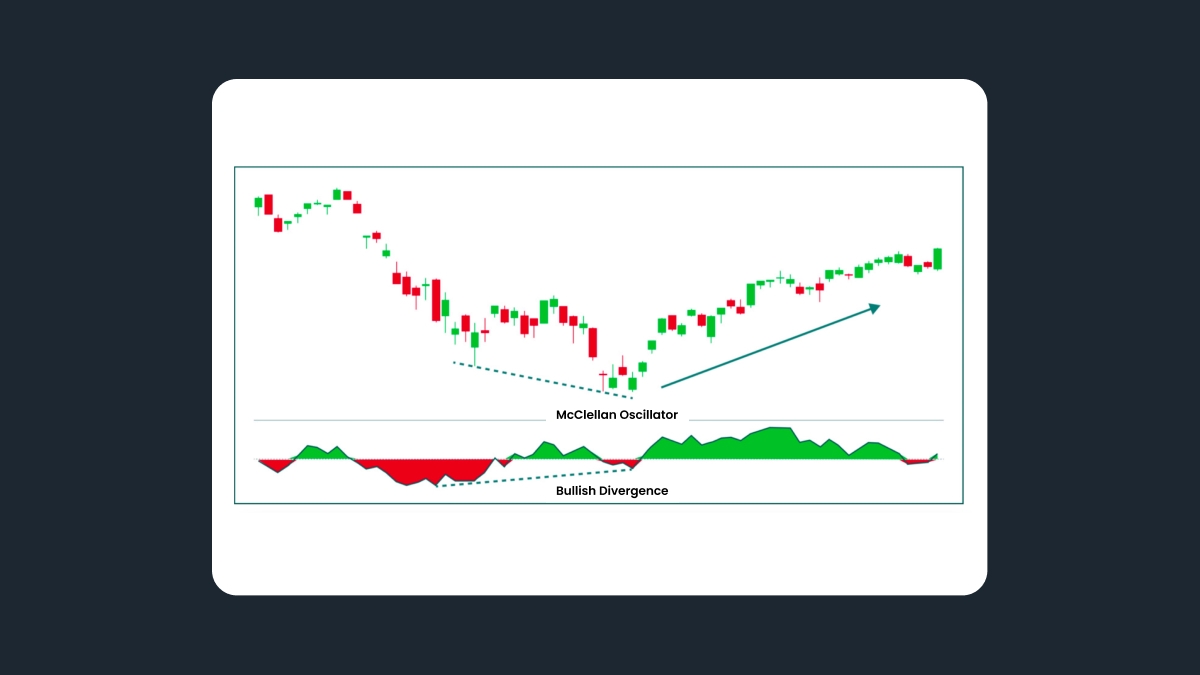
Bullish divergence means the index's price forms lower lows while the indicator forms higher lows. This warns the trader that the downtrend may be over, and could be a signal for opening buy positions or closing sell positions.
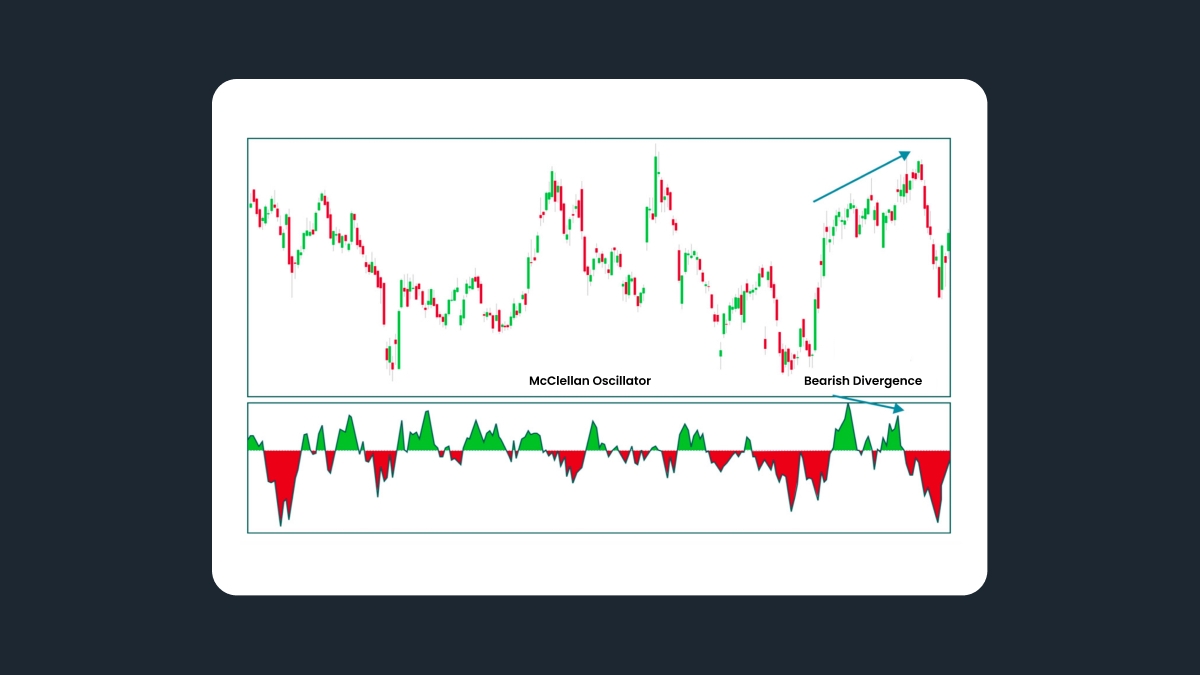
Bearish divergence means that the price forms higher highs, and the indicator forms lower highs. This alerts the trader that the uptrend may be over. It may be a signal to open sell or close buy positions.
The MO is similar to the Moving Average Convergence Divergence indicator (MACD) in many ways.
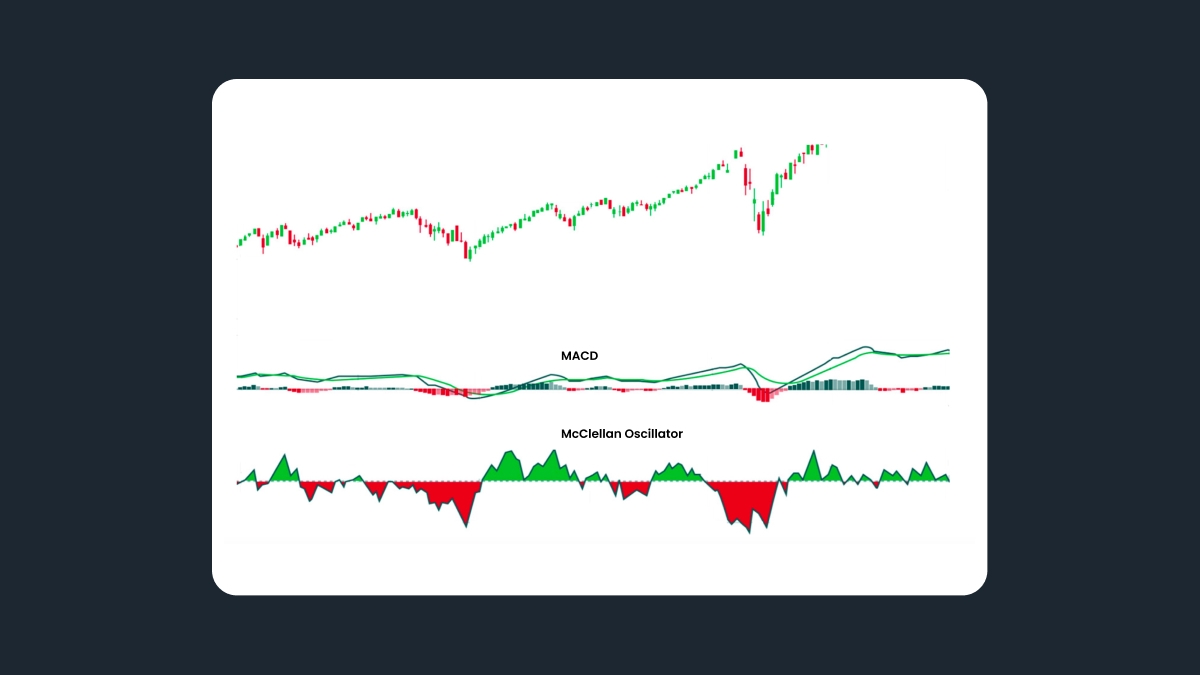
As with the MACD indicator, when the MO gives a positive value, that is usually a reliable sign that the market is best suited for bullish investors. Conversely, negative values are usually a positive sign for bearish investors.
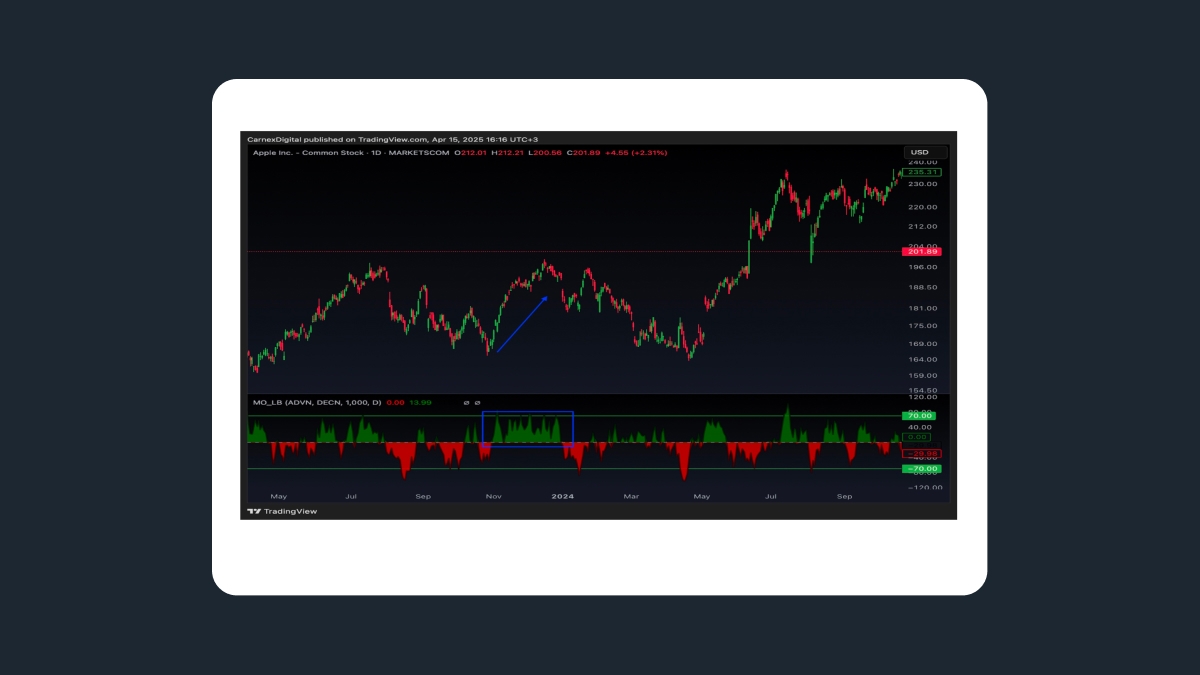
Another thing to track using this indicator is bursts that indicate a longer period of movement is about to occur – higher or lower, depending on the pull.
Combining the MO with other indicators
While it can provide valuable insights, combining the McClellan Oscillator with other indicators and oscillators can enhance its effectiveness and provide a more comprehensive analysis of market conditions. Below, we explore combining the McClellan Oscillator with other tools for a more robust trading approach.
Moving Averages: One common approach is using moving averages with the McClellan Oscillator. By overlaying a longer-term moving average on the McClellan Oscillator chart, such as the 200-day moving average, traders can identify the overall trend and confirm potential buy or sell signals. When the McClellan Oscillator crosses above the moving average, it can signal bullish market conditions, and the OM crossing below the moving average may indicate bearish conditions.
Relative Strength Index (RSI): Combining the McClellan Oscillator with the RSI can provide additional confirmation of potential market reversals. When the McClellan Oscillator reaches extreme overbought or oversold levels, traders can look for a corresponding divergence or confirmation from the RSI. If the RSI indicates overbought or oversold conditions, it strengthens the signal for a potential reversal in the market.
Volume Analysis: Analyzing volume alongside the McClellan Oscillator can offer valuable insights into market sentiment. By observing volume patterns during McClellan Oscillator crossovers or divergences, traders can assess the strength or weakness of a particular market move. Higher volume during bullish McClellan Oscillator crossovers or decreasing volume during bearish divergences can provide confirmation of the potential trend reversal.
McClellan Oscillator trading strategies
The McClellan Oscillator is a versatile tool that can be used to develop various trading strategies. Understanding different approaches to utilizing the McClellan Oscillator can enhance your ability to capitalize on market opportunities. Here, we will explore a few common McClellan Oscillator trading strategies:
Overbought/Oversold Strategy: One popular strategy involves identifying overbought or oversold conditions. When the oscillator reaches extreme levels, it may indicate a potential reversal. Traders can look for other confirmations, such as reversal candlestick patterns or moving averages crossover, and initiate trades in the opposite direction of the extreme reading. For example, if the McClellan Oscillator reaches overbought levels, traders may consider short-selling or taking profits on long positions.
Divergence Strategy: Divergence occurs when the McClellan Oscillator moves in the opposite direction of the price action. Bullish divergence happens when the price makes a lower low while the oscillator makes a higher low, suggesting potential upward momentum. Conversely, a bearish divergence occurs when the price makes a higher high while the oscillator makes a lower high, indicating potential downward pressure. Traders can use these divergences as signals to enter or exit trades, depending on the direction of the divergence.
- Trend Confirmation Strategy: The McClellan Oscillator can also be used to confirm the strength of a prevailing trend. If the oscillator remains consistently positive during an uptrend or negative during a downtrend, it signals the trend's sustainability. Traders can use this confirmation to stay in trades or add to their positions. Conversely, a shift in the McClellan Oscillator towards zero or a crossover to the opposite side may indicate a potential trend reversal, prompting traders to exit or consider a position reversal.
Limitations of the McClellan Oscillator
While the McClellan Oscillator is a valuable market breadth indicator, understanding its limitations can help traders make more informed decisions and avoid potential pitfalls. Here are some key limitations to consider:
Lagging Indicator: Like many technical indicators, the McClellan Oscillator is a lagging indicator. It relies on past price data to generate signals and may not provide timely indications of market turns or reversals. Traders should use it with other indicators and analysis techniques to confirm signals and avoid false alarms.
Sensitivity to Market Conditions: The effectiveness of the McClellan Oscillator can vary depending on market conditions. It works better in trending markets rather than choppy or sideways markets. The oscillator may generate false or conflicting signals during low volatility or consolidation periods, leading to potential trading losses.
Reliance on Breadth Data: The McClellan Oscillator is derived from breadth data, specifically the advancing and declining issues on the NYSE and NASDAQ. It may not accurately reflect the overall market sentiment if the breadth of the data is skewed or there are limitations in the data collection process. Traders should consider using additional breadth indicators and corroborating evidence to validate the signals generated by the oscillator.
Market Specificity: The McClellan Oscillator was initially developed for the US stock market, specifically the NYSE and NASDAQ. While it can be applied to other markets, its effectiveness may vary. Traders should consider adapting the indicator and its parameters to suit their trade markets' specific characteristics and dynamics.
The difference between the McClellan Oscillator and the McClellan Summation Index
The McClellan Oscillator and McClellan Summation Index are two related market breadth indicators developed by Sherman and Marian McClellan. While they are based on similar principles and use similar data, they have distinct differences. Here's an overview of these differences:
McClellan Oscillator:
Calculation: The McClellan Oscillator is calculated by taking the difference between two exponential moving averages (EMAs) of advancing and declining issues. The commonly used EMA periods are 19 and 39 days.
Interpretation: The McClellan Oscillator oscillates around a zero line, with positive values indicating bullish market conditions and negative values indicating bearish conditions. Traders often look for divergences, crossovers, or extreme readings to generate trading signals.
Short-Term Indicator: The McClellan Oscillator is considered a short-term indicator, providing insights into shorter-term market trends and potential reversals.
McClellan Summation Index:
Calculation: The McClellan Summation Index is derived from the cumulative McClellan Oscillator values. It adds up the daily Oscillator values, creating a running total.
Interpretation: The McClellan Summation Index provides a broader view of market breadth and trend strength. It helps identify the overall market direction and the persistence of bullish or bearish conditions. Traders often look for trendline breaks or divergences to confirm potential trend reversals.
Long-Term Indicator: The McClellan Summation Index is considered a long-term indicator, offering insights into longer-term market trends and sustained movements.
Key Difference:
The key difference between the McClellan Oscillator and McClellan Summation Index lies in their timeframes and the information they provide. The McClellan Oscillator focuses on shorter-term market conditions and provides more frequent signals, while the McClellan Summation Index offers a broader perspective on longer-term trends and market breadth.
Summary
The McClellan Oscillator is a powerful market breadth indicator that helps traders analyze the market direction and potential reversals. It calculates the difference between short-term and long-term exponential moving averages to generate positive or negative values, indicating bullish or bearish trends.
By identifying bullish or bearish divergences and overbought/oversold conditions, traders can anticipate trend reversals and take contrarian positions. Combining the oscillator with other indicators like moving averages, RSI, and volume analysis enhances its effectiveness.
The McClellan Oscillator is a versatile tool for swing and long-term traders. Mastering its calculation, installation, and trading strategies can improve decision-making and trading performance. However, practicing risk management and adapting strategies to changing market conditions is essential.