.jpg)
What is Parabolic SAR
SAR stands for “stop and reverse”. This name refers to the fact that the indicator can not only determine a trend, but also signal when it’s time to close a trend trade and look in the opposite direction. The indicator was developed by J. Welles Wilder, who is also known for creating such tools as ATR and RSI.
How to implement the Parabolic SAR
The Parabolic SAR is included in the default settings of MetaTrader. You can add it to the chart by clicking Insert – Indicators – Oscillators and then choosing Parabolic SAR.
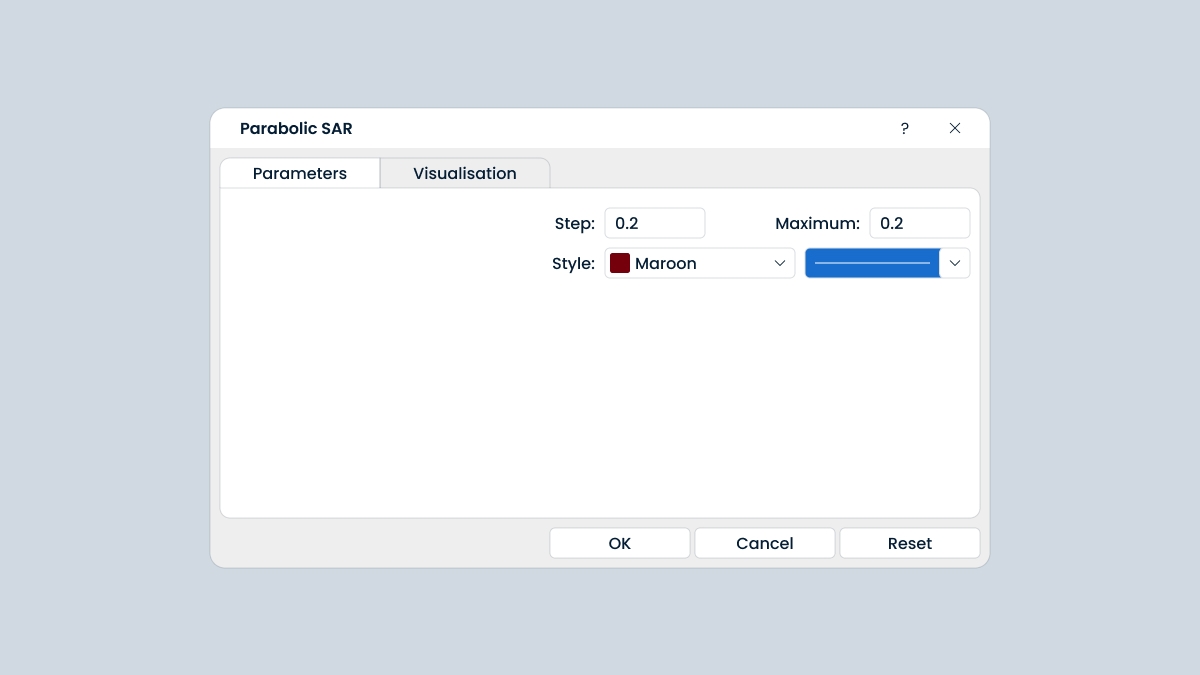
The indicator has 2 parameters you must set: step and maximum. Their default values are 0.02 and 0.2. A step is the size of the acceleration factor. The acceleration factor starts with this value and then increases by the step size with each new high (or low for a downtrend), up (or down) to the value defined by the maximum (or minimum) parameter.
You can start with the default parameters of the indicator and then adjust them to the asset you trade, timeframes you use, and your trading style. You can control the indicator’s sensitivity to the price: the higher the acceleration factor, the closer to the price it will move. However, you shouldn’t set it too high, or there will be too many reversal signals. Wilder recommended not to set the maximum above 0.22.
How to interpret the Parabolic SAR indicator
The Parabolic SAR is very simple to use. It consists of placing dots that define the trend. When the dots are below the price, the trend is bullish; dots above the price point to a bearish trend.
When the trend changes direction, the Parabolic SAR gives an entry signal. When the price crosses to the upside and forms 3 descending dots above the candlesticks, the Parabolic SAR signals a bearish reversal.
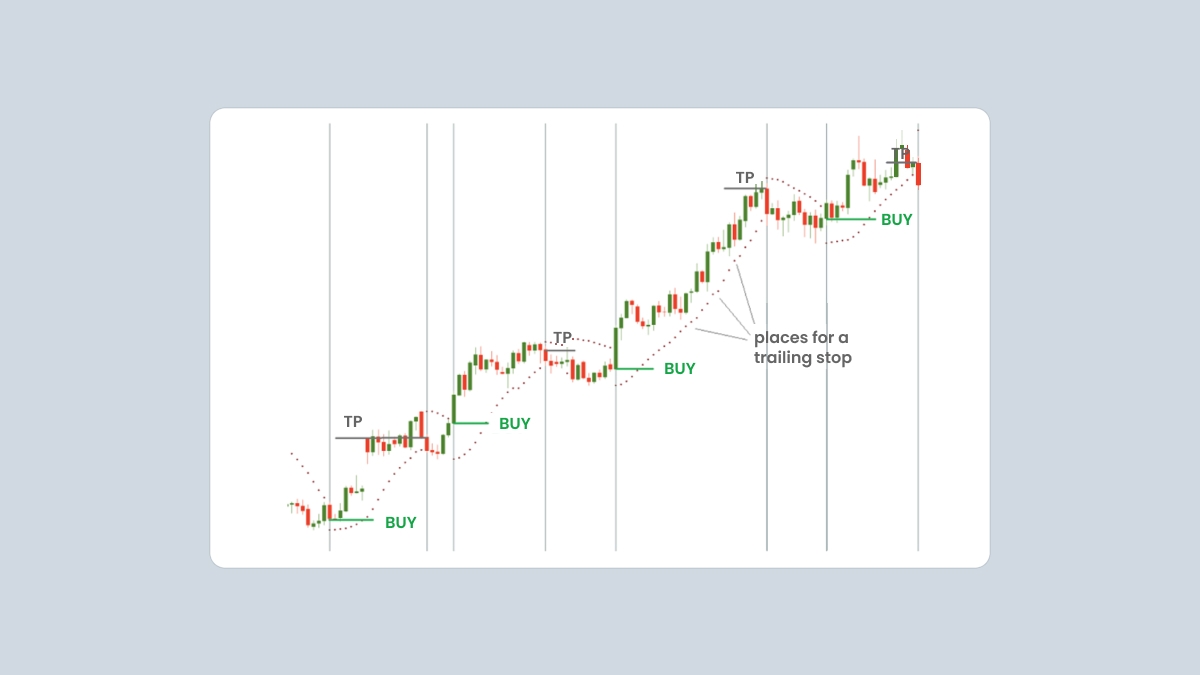
The indicator also offers great help in determining exit points. Its prescription is simple: you close a buy trade when the SAR returns above the price, and close a sell trade when it goes back below the price. This way, you only hold open positions in the direction the indicator is moving.
Moreover, the Parabolic SAR provides a framework for trailing stops. In an uptrend, the indicator will rise following the surging prices. Move your stop-loss order from one dot to the next in order to limit the risks and lock in profit.