.jpg)
The idea that the market moves in a series of waves was developed by Ralph Nelson Elliott. Bill Wolfe proposed his own view on waves in technical analysis. The price in a Wolfe Wave pattern swings like a pendulum trying to find equilibrium. Wolfe discovered a reversal pattern in which, after trading within a channel during 4 waves, the price makes a breakout (leaves the channel) in the fifth wave.
You'll be pleased to know that a Wolfe Wave pattern can be found on any timeframe and on the chart of any financial instrument.
Bullish Wolfe Waves
There’s a very strict set of rules that define this pattern. Let's study a bullish Wolfe Wave pattern.
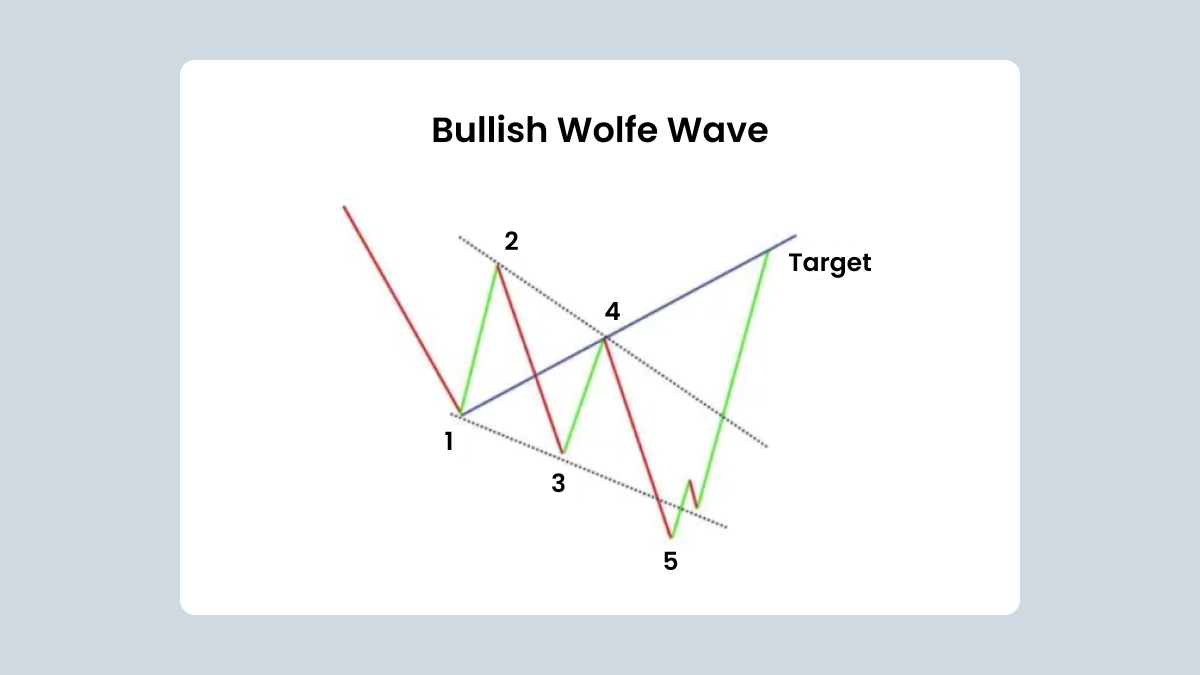
Here are the key parameters of a bullish Wolfe Wave pattern:
Wave 1-2 is the base of the pattern and is bullish.
Point 2 should be higher than Point 1, and Point 3 should be below point 1.
Wave 3-4 should stay within the channel created by ave 1-2. Waves 1-2 and 2-3 should be equal (symmetric). Point 3 is usually at the 127.2% or 161.8% extensions of Wave 1-2. Point 4 should be below Point 2 and above Point 3.
Point 5 is the low set after Wave 3-4. It’s located close to the line drawn through Points 1 and 3. Point 5 is usually at the 127.2% or 161.8% extension of Wave 3-4.
Point 6 lies on the line drawn from Point 1 through Point 4. Wave 5-6 is the longest wave of the pattern. Points 1, 4, and 6 lie along one line.
How to trade
The idea of trading on a bullish Wolfe Wave pattern is to buy on the breakout of the 1-3 line, after the formation of Point 5. The take-profit order should be located at Point 6.
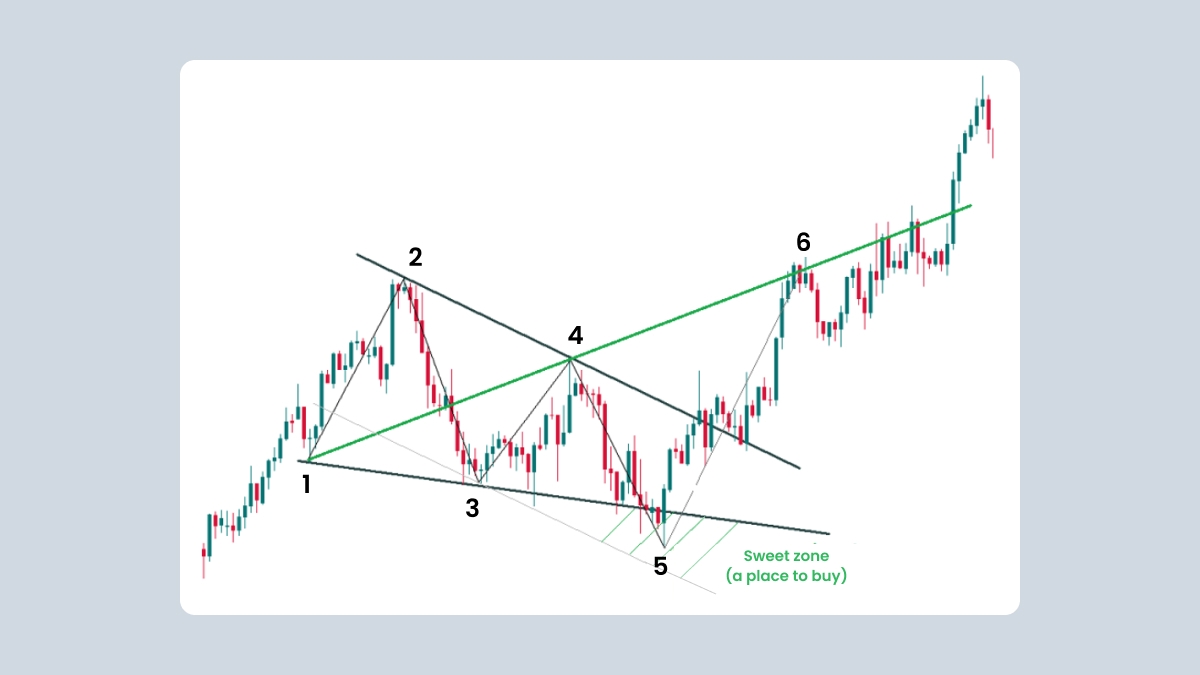
Point 5 can be at or below the 1-3 line. In this case, draw an auxiliary line through Points 2 and 4 and move this line in parallel to Point 3. The space between the 1-3 line and the projection of the 2-4 line from Point 3 is called the "sweet zone". This is where you should look for the opportunity to buy. If the 2-4 line is parallel to the 1-3 line, then there’s no sweet zone. If the angle between the 1-3 line and the projection of the 2-4 line is too sharp, there’s a mistake and it’s not a Wolfe Wave pattern.
Check out this example of a bullish Wolfe Wave pattern in MetaTrader:
Bearish Wolfe Waves
Now let's examine a bearish Wolfe Wave pattern.
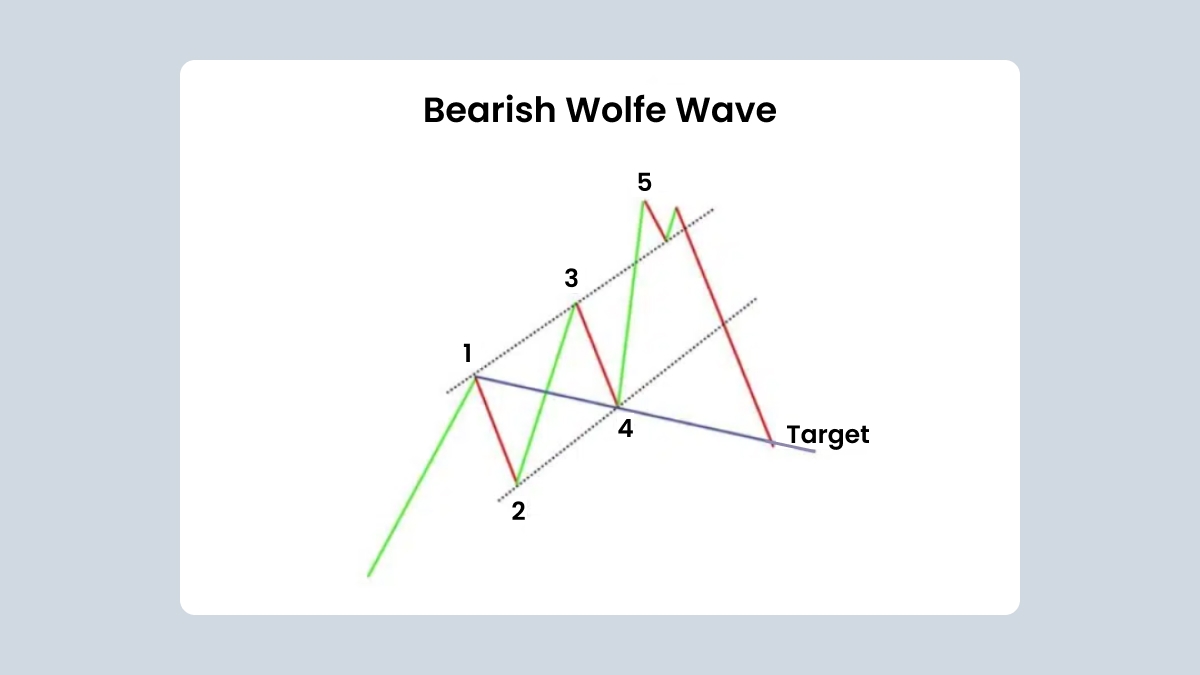
Here are the key parameters of a bearish Wolfe Wave pattern:
Wave 1-2 is the base of the pattern and is bearish.
Point 2 should be lower than Point 1, and Point 3 should be above Point 1.
Wave 3-4 should stay within the channel created by ave 1-2. Waves 1-2 and 2-3 should be equal (symmetric). Point 3 is usually at the 127.2% or 161.8% extensions of Wave 1-2. Point 4 should be above Point 2 and below Point 3.
Point 5 is the high set after Wave 3-4. It’s located close to the line drawn through Points 1 and 3. Point 5 is usually at the 127.2% or 161.8% extension of Wave 3-4.
Point 6 lies on the line drawn from Point 1 through Point 4. Wave 5-6 is the longest wave of the pattern. Points 1, 4, and 6 lie along one line.
How to trade
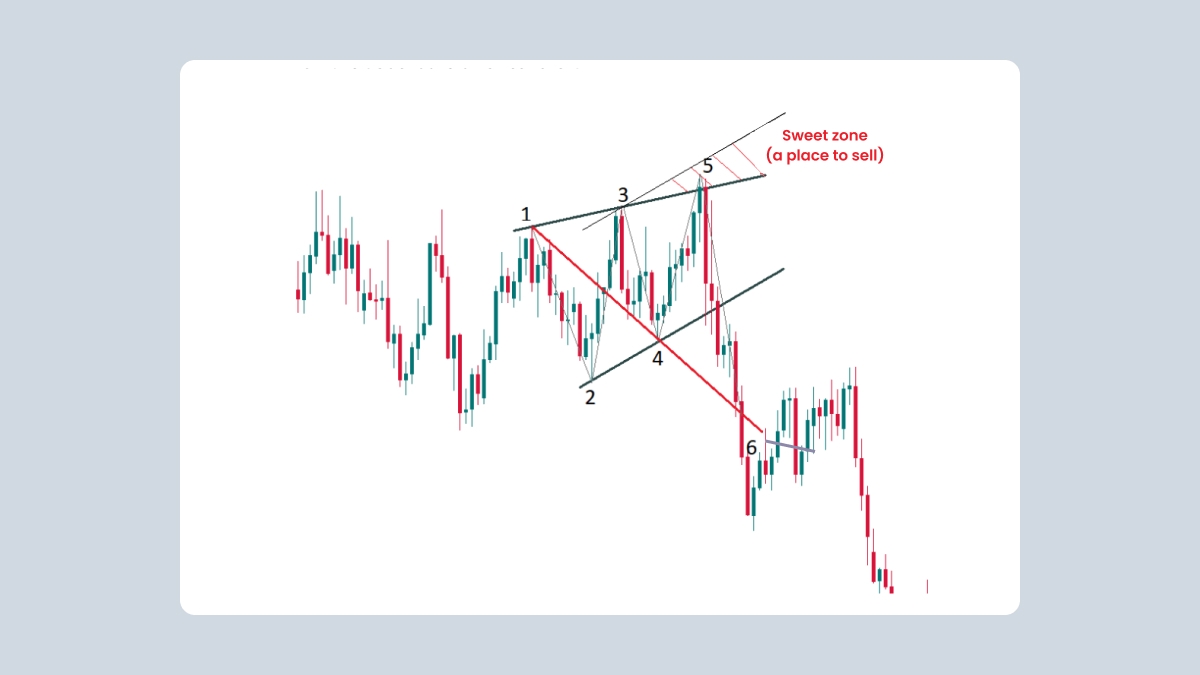
Like the mirror image of a bullish Wolfe Wave pattern, the idea of trading the bearish Wolfe Wave pattern is to sell on the breakout of the 1-3 lines after the formation of Point 5. The take-profit order should be located at Point 6. Here's how this trade looks on a real chart:
Summary
To find a Wolfe Wave pattern on the chart, look for 3 points that lie along one line. Check for Points 2 and 4 nearby and see whether what you’re observing fits the description of a bullish or bearish pattern.
We recommend trading on Wolfe Wave patterns for those who already have some Forex trading experience. It's not easy to recognize these setups on the charts. However, once recognized, the pattern generates a signal that offers a very high probability of a successful trade, so if you master it, you'll have some spectacular trades.