Unlike motive waves, corrections are more complicated and tricky structures. They're simple and complex correction patterns:
- Zigzag
- Flat
- Double / Triple Zigzag
- Double / Triple Threes
- Triangles
The first two (a zigzag and a flat) are simple patterns, which are bricks of complex corrections. In this article, we're going to examine zigzag and flat patterns.
What's a ZigZag pattern in trading?
The Zigzag pattern is a movement of the price in the form of a zigzag. In a nutshell, it's a line connecting two almost parallel lines so that they form a zigzag shape. It's a so-called "correction wave," and it can lead to bullish, bearish, or sideways movement depending on the circumstances. Later in this article, we'll describe every zigzag pattern you may meet in your trading routine and how to identify it in your trading platform.
Like most correction patterns, zigzag subdivides into three waves, which are marked as A-B-C.
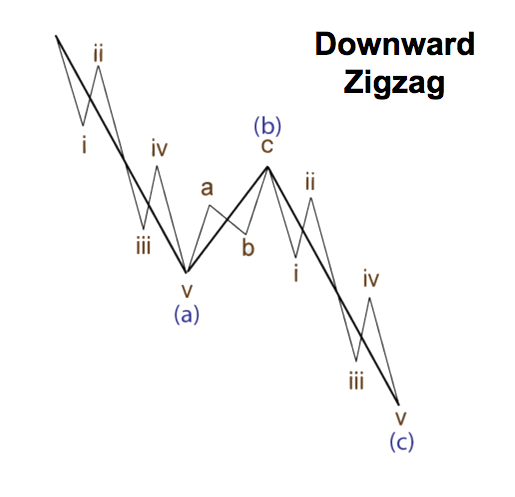
The Main Rules for Zig Zag Patterns
- Zigzags subdivides into three waves.
- Wave A is always an impulse or a leading diagonal.
- Wave B could take the form of any correction pattern.
- Wave C is always an impulse or an ending diagonal.
- Wave B is shorter than wave A.
- Wave C is longer than wave B.
- Waves A and C are motive, wave B is corrective.
Most traders believe price goes in waves. Zigzag is one of the most important price waves, and you can spot it after almost every impulsive wave (impulse that contains five waves). Remembering these rules may seem hard at first glance, but when you get accustomed to them, your trading will improve gradually.
Also, you can set up a Zig Zag indicator, a trading tool that helps you to identify correction waves.
The Zig Zag Indicator Formula
We'll start from a complex formula for advanced traders and then move to a simpler version.
ZigZag (HL, %change = X, retrace = FALSE, LastExtreme = TRUE)
If %change >= X, plotZigZag
where:
HL = High-Low price movement
%change = Minimum price movement, in percentage
Retrace = Is a retracement of the previous move or an absolute change from peak to trough
LastExtreme = If the extreme price is the same over multiple periods, the extreme price is the first or last observation
This formula is useful if you need to set up your own Zig Zag indicator. And if you just want to understand how a Zig Zag indicator works, here're some tips.
Choose a starting point (swing high or swing low).
Choose % price movement.
Identify the next swing high or swing low that differs from the starting point => % price movement.
Draw trendline from starting point to new point.
Identify the next swing high or swing low that differs from the new point => % price movement.
Draw trendline.
Repeat the most recent swing high or swing low.
"=>" means "is equal or bigger than" (e.g. X => 5 means "X is equal or bigger than 5).
To install a Zig Zag indicator, you need to download it from the MQL5 website and follow our tutorial on how to install a custom indicator in MetaTrader.
Zig Zag Indicator Limitations
Zig Zag is a lagging technical indicator that is moving after the market, now in front of it. That means you may see a movement almost ending, and suddenly, a Zig Zag indicator draws a line. Thus, you may consider using this indicator with other powerful technical indicators to help you spot an upcoming movement earlier. A such indicator is the Fibonacci retracement tool that helps traders to mark possible support and resistance lines. Don't forget to read about technical indicators in MT5 to understand how they work.
What is a Flat Pattern in Trading?
A flat pattern is a correction wave subdividing into three waves and marked as A-B-C, but the structure is different. It is a corrective pattern that runs against the trend. The pattern tends to be a retracement of the previous trend and may look like a flag pattern. At other times, it may look like a simple range that spends more time going sideways than making any real progress in price.
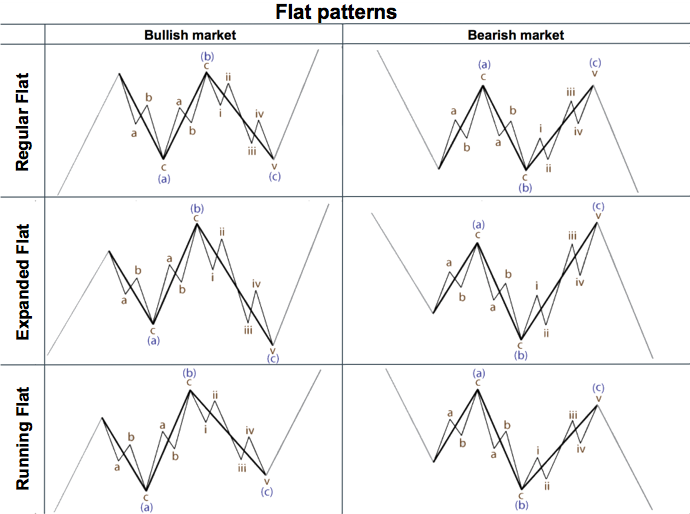
Types of Flat Patterns
As you can see from the chart below, there’re three types of the flat pattern depending on the length of waves B and C.
Regular Flat: Wave B is almost equal to wave A (at least 90%), while wave C tends to be equal to wave B.
Expanded Flat: Wave B is longer than wave A and wave C is longer than wave B.
Running Flat: Wave B is longer than wave A, but wave C is shorter than wave B.
The Main Rules for Flat Patterns
- Flats consist of three waves.
- Wave A could be any correction pattern except triangles.
- Wave B could be any correction pattern, but in most cases, it's a zigzag.
- Wave C is always an impulse or an ending diagonal.
- Wave B has a length of more than 90% of wave A.
- Wave C is usually equal or even longer than wave B.
- Waves A and C are motive, wave B is corrective.
Real Examples of Zig Zag and Flat Patterns
Downward Zig Zag Pattern
The chart shows a simple zigzag in wave (ii) with impulses in waves a and c. This is the most common structure of zigzags. Also, pay attention to a leading diagonal, which has formed after wave (ii). The pattern confirmed the ending of the zigzag.
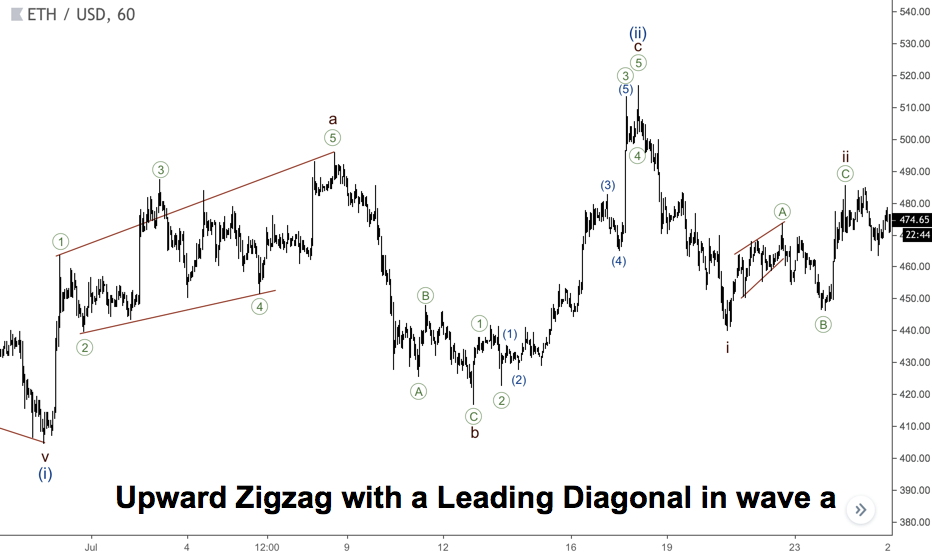
Upward Zig Zag with a Leading Diagonal in Wave a
Elliott wave patterns form on all markets, including cryptocurrencies. There’s Ethereum chart below, where we could find three zigzags. The biggest one is wave (ii). As you can see, the wave (a) of (ii) is a leading diagonal pattern. Wave ii (on the right) is a zigzag with the same structure (wave ((A)) is a leading diagonal). Another zigzag is wave b (in the middle of the chart), its wave ((A)) is far longer than wave ((C)). Sometimes such a disproportion happens, so now you know what you can face with.
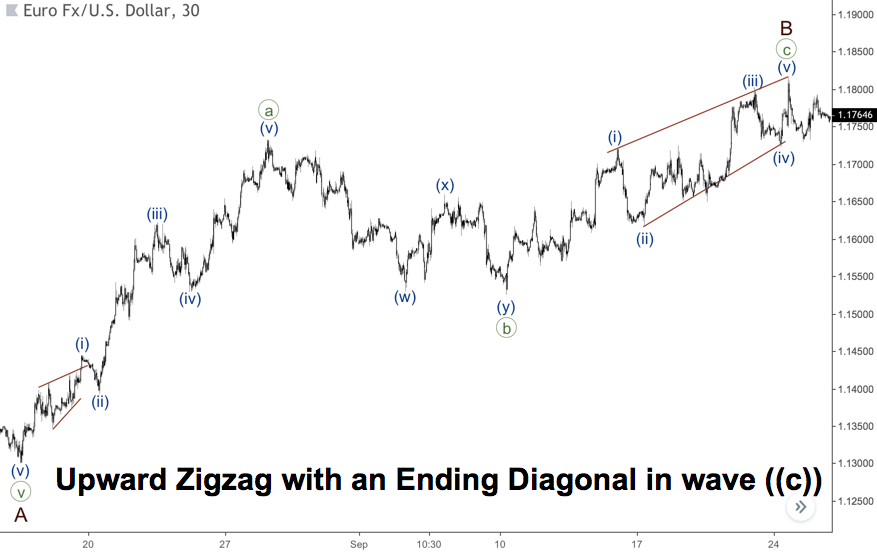
Upward Zig Zag with an Ending Diagonal in Wave ((c))
It’s also possible to have a zigzag with an ending diagonal in wave C, you can see this case on the next chart. Wave ((a)) here is an impulse, but after wave ((b)) there’s an ending diagonal in wave ((c)). As you already know, an ending diagonal could form in a position of the last wave of a motive wave (wave five of an impulse or wave C of a zigzag).
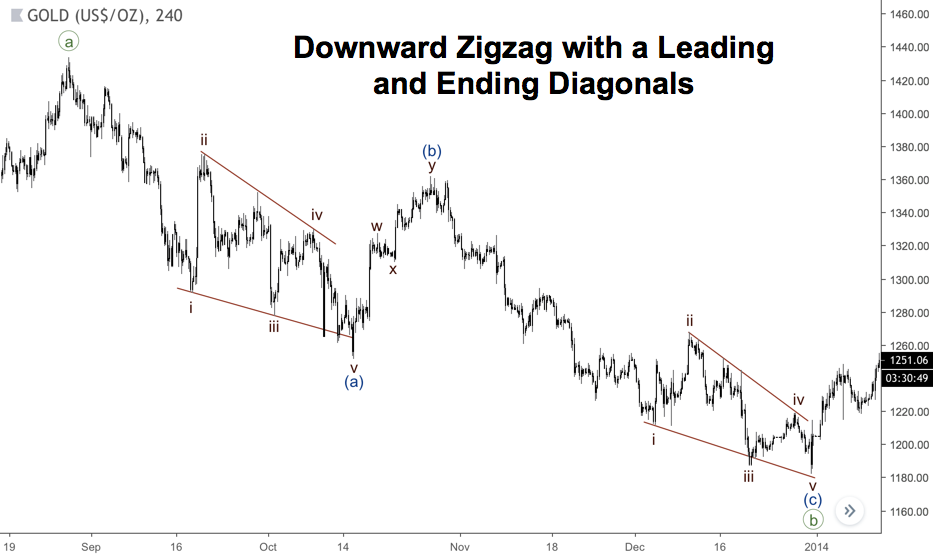
Downward Zig Zag with a Leading and Ending Diagonals
The chart below represents such a rare case when motive waves of a zigzag are formed like leading and ending diagonals. Contracting diagonals are more common, but we also could face a structure with expanding ones.
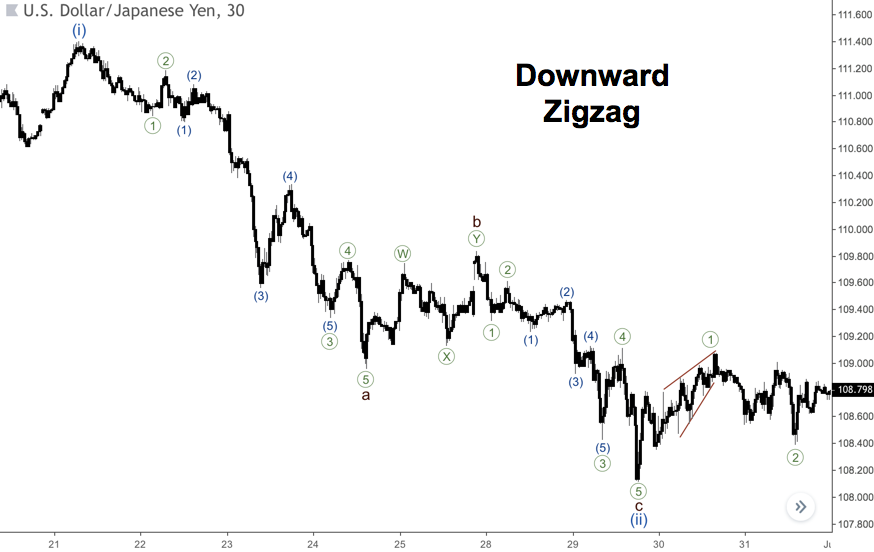
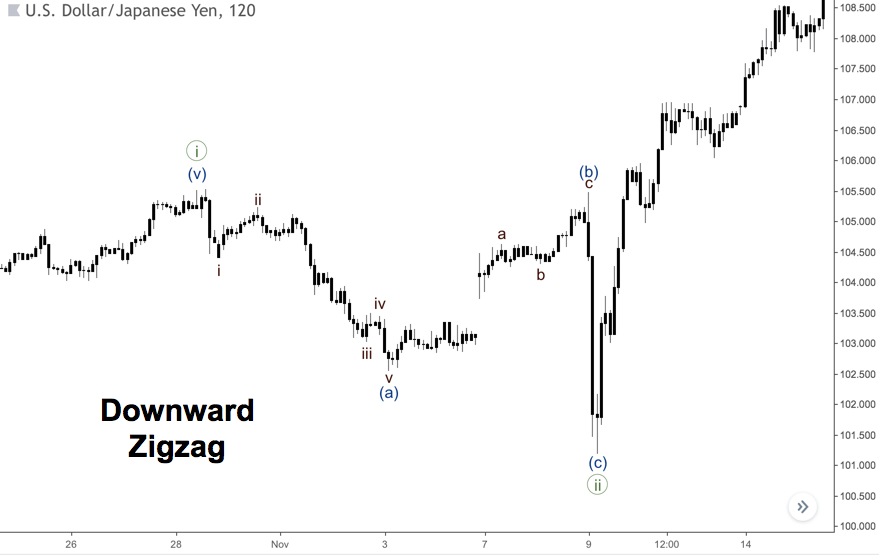
Downward Zig Zag
Sometimes wave C of a zigzag could be fast-moving as you can see on the next chart. There’s a plain and clear structure of the wave (a), but wave (c) consists of only three bars. This usually happens when news or political events influence the price movement.
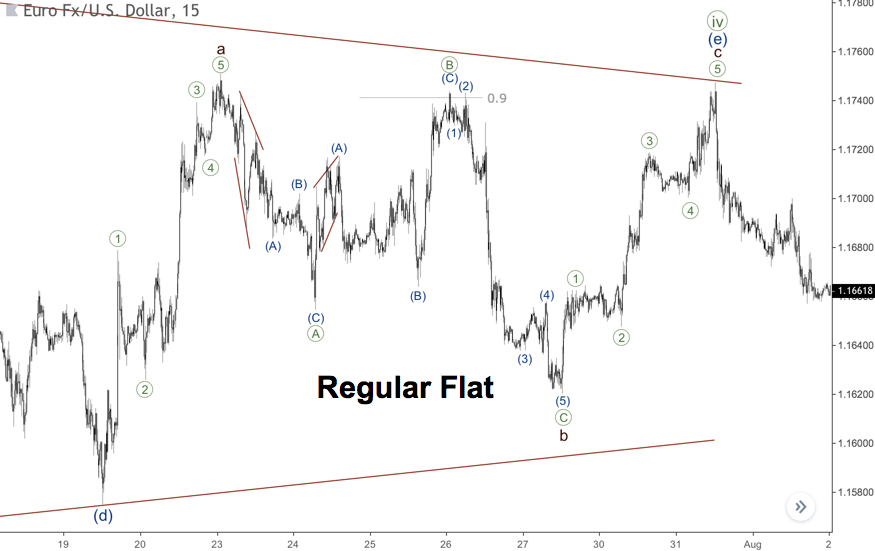
Regular Flat Pattern
There’s a flat pattern in wave b on the chart below. This is a regular flat because wave ((B)) is about 0.9 of wave’s ((A)) length. However, the wave ((C)) is pretty fast. There’s one more interesting thing. There’re two zigzags in waves ((A)) and ((B)). The first pattern has wave (A) as an expanding leading diagonal, which is quite rare. The next zigzag has a contracting leading diagonal in wave (A) of ((B)), which is more common.
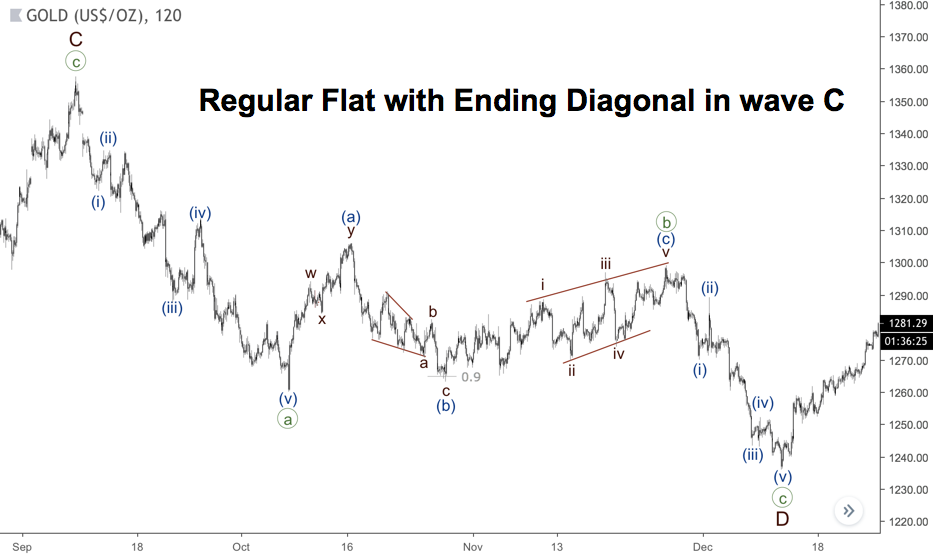
Regular Flat with Ending Diagonal in wave C
Wave C of a flat pattern could be also an ending diagonal as shown on the next chart. Wave (b) is shorter than wave (a), so it’s a regular flat. However, an ending diagonal in wave (c) finishes below the high of wave (a) that is how running flats ends. As you can see, there’re some variations in each type of flat patterns in the real market.
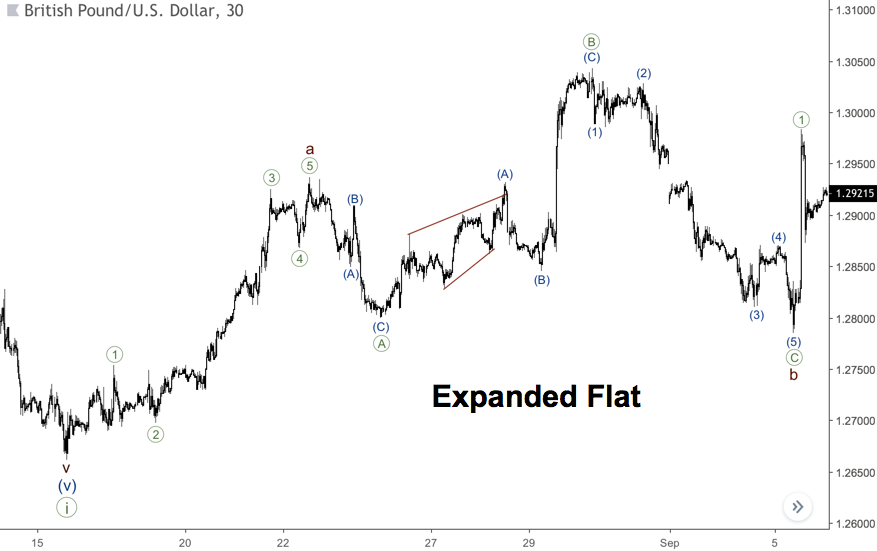
Expanded Flat Pattern
The last chart shows a perfect example of an expanded flat pattern. Wave ((B)) is far longer than wave ((A)) and the ending of wave ((C)) breaks the low of wave ((B)). The subsequent bullish impulse in wave ((1)) confirms that a flat pattern is over.
Conclusion
Identifying a flat or a zigzag pattern may be hard for novice traders as they need to know a lot of variations of such patterns. Although these patterns may seem complicated, understanding them gives a trader a better understanding of the global market structure. Thus, these patterns may be useful in various trading techniques. Also, consider checking our tutorials on ROC indicator and Aaron indicator to know more about trading.