FBS turns 16
Retracement
What is retracement?
A retracement is defined as a temporary change in price movement against the price direction of a financial instrument, such as Forex, stock, gold, index, etc. After a retracement, the price eventually returns to continue the overall trend.
As retracements do not indicate a major change, it is better to consider their temporary nature. Otherwise, traders can be tricked by this minor pullback and make an unfavorable move in their trades.
Retracement in a nutshell
Retracement can be described as a temporary interruption in a trend. However, it can happen anytime in a continuous process of the price going up and down.
Market players need to know how to identify retracements to have more winning trades. For example, they may pay attention to the so-called indecision candles with long tops and bottoms. Other factors may be short interest, when it experiences no change and a retracement happens, or the volume of trades.
Also, there is such a method as Fibonacci retracements in technical analysis. It helps to determine important support and resistance levels. With this knowledge, traders can identify the entry points, set Stop Loss and Take Profit levels, and predict the movement against the trend.
Retracement and reversal: the difference
As mentioned before, a retracement is a temporary price change within a price trend. On the contrary, a reversal occurs when one trend ends and another begins — in other words when the overall price trend experiences a significant change.
In this case, the price is very likely to continue in that direction for an extended period. It can be an uptrend switching to a downtrend or vice versa.
Moreover, a retracement practically carries no change in the fundamentals. Alternatively, a reversal is usually accompanied by changes in the fundamentals or hints of changes. Finally, note that it may be hard to tell immediately if it is a temporary retracement and a slight price change or a reversal. That is why it takes time before you realize how to act in some cases.
If you are unsure whether it is a temporary or real reversal, you can always reduce the risk with Stop Loss.
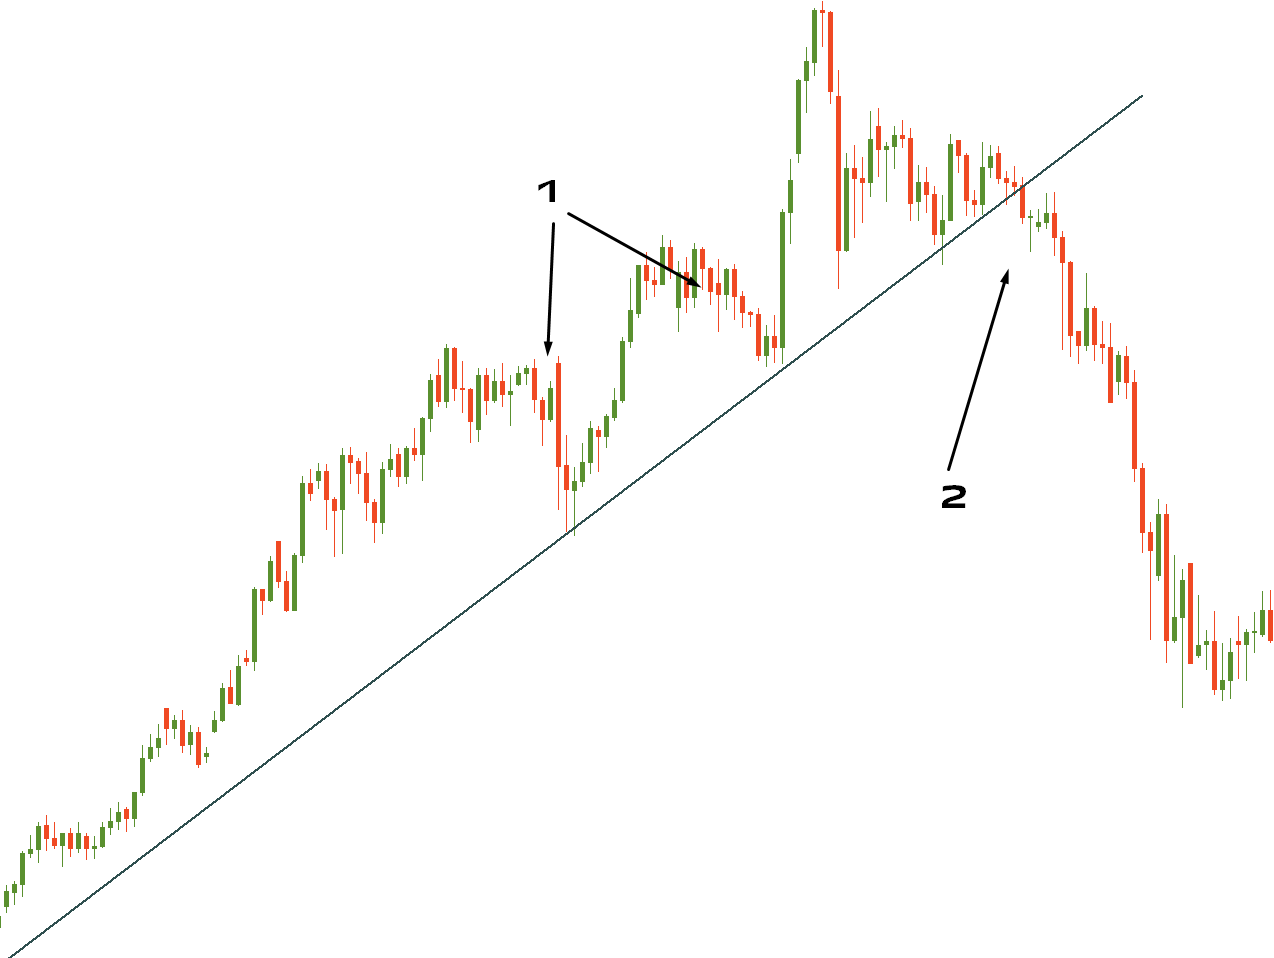
1 – Retracements
2 – Reversal