Easy Intraday Strategy (Candlestick Patterns + RSI)

Read the article on FBS website

There are a lot of valuable strategies that require the knowledge of candlestick patterns and oscillators. However, not of them are profitable. When you start trading with them, you can face situations when the strategy is not moving your way. That’s what happens when you don’t do a thorough checkup of your trading strategy. Luckily, we backtested several strategies based on a combination of oscillators and candlestick patterns and chose the best one for you! Please welcome – the RSI and Bullish/Bearish Engulfing Pattern Strategy!

Strategy Setups

Instruments: EURUSD

Indicators: RSI with 11th period

Timeframe: H4

Risk management rules: Fixed trade volume with 0.1 lot

Rules for a long entry

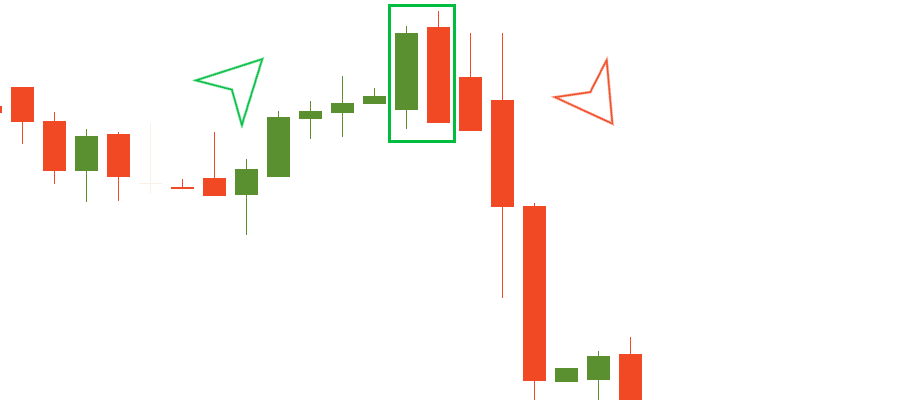
1. Wait for a formation of the Bullish Engulfing pattern. This is the reversal pattern that forms at the end of the downtrend. It consists of a small red candlestick and a large green candlestick that engulfs the red one. The shadows of the small candlestick are short.

1.png

2. The candlestick pattern must be confirmed by the RSI indicator moving below the 40 level.

3. Open you position at the next candlestick after the pattern is confirmed.

4. You must close the short position when the RSI indicator crosses the 70 level to the upside.

2.png

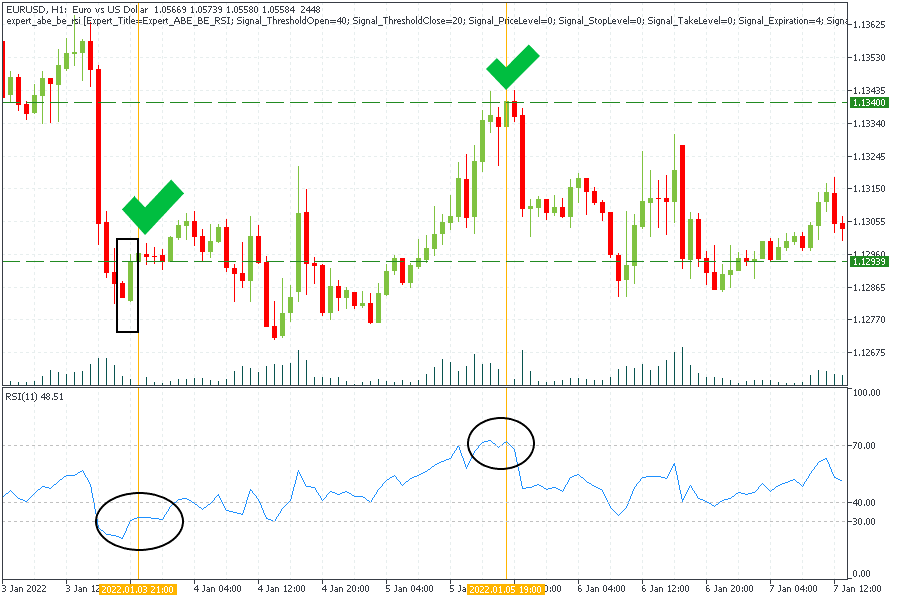
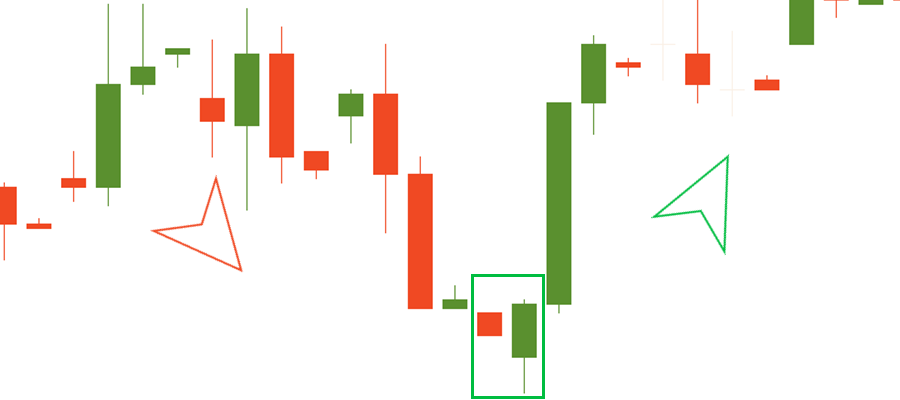
On the picture above you can see an example of this strategy on the H1 timeframe of the EURUSD chart.

After the price formed a pattern known as the Bullish engulfing, we checked RSI and it was moving below the 40 level. We opened a long trade at the opening price of the next bullish candlestick after the pattern at 1.12939. We closed the trade when RSI crossed the 70 level at 1.1340. We earned 461 points.

Rules for a short entry

1. Wait for a formation of the Bearish Engulfing pattern. It consists of a small green candlestick followed by the big red one.

3.png

2. The candlestick pattern must be confirmed by the RSI indicator that should be above the 60 line.

3. After the pattern is confirmed, you need to open a sell order at the next candlestick. It should be bearish.

4. You need to close the short position when the RSI indicator crosses the 30 level to the downside.

4.png

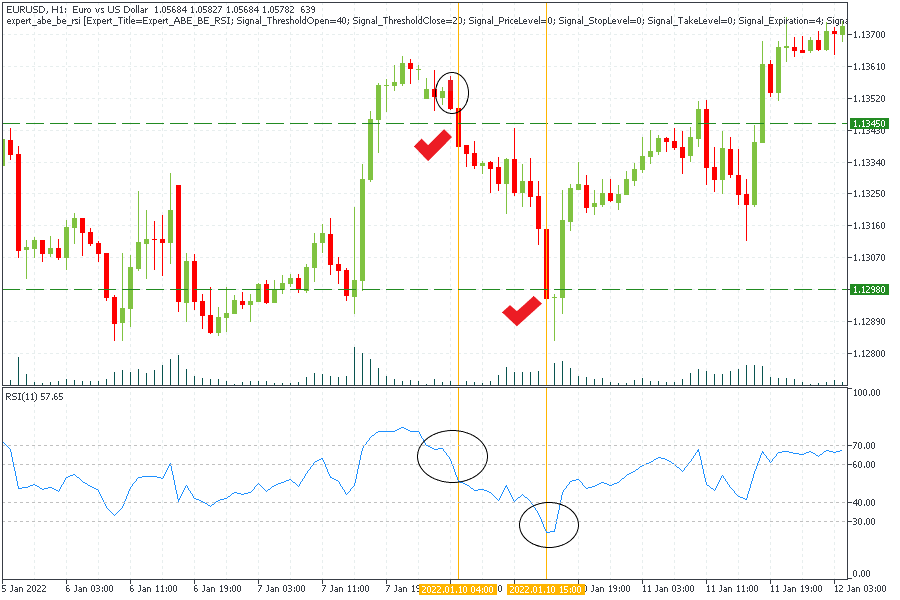
On the chart above, we opened a sell order after the Bearish Engulfing pattern was confirmed by RSI moving above the 60 level at 1.1345. After RSI entered the oversold zone, we closed our position at 1.1298. We earned 470 points.

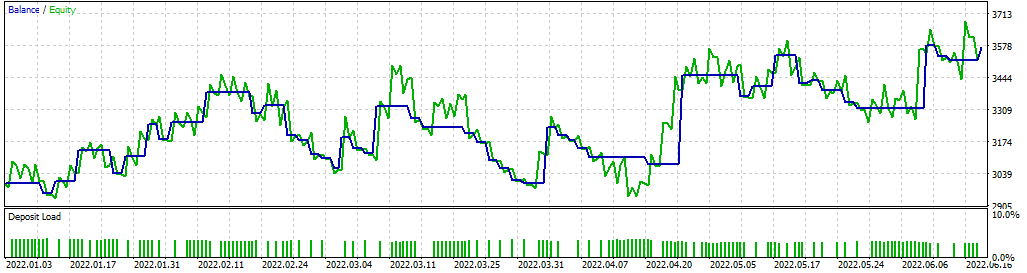
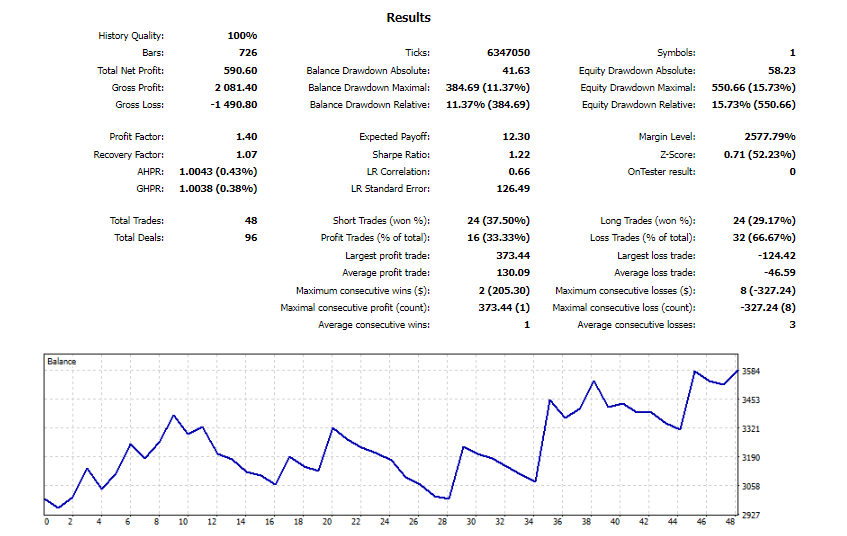
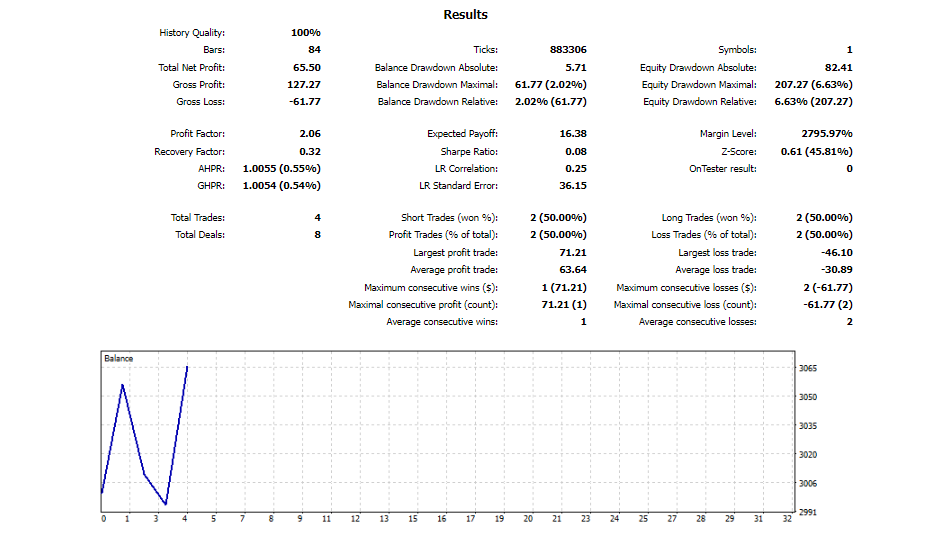
Backtesting a strategy

5.png

The strategy was tested monthly and yearly and brought good results.

6.png

Let’s look at the profit factor. This metrics shows how much money you make compared to how much money you lose. The test on one year with $3000 of the deposit and the leverage of 1:100 showed a profit factor of 1.40. The figure is greater than 1, so the strategy can be named reliable. Now let’s look at the recovery factor. This is the absolute value of net profit divided by maximal drawdown. The recovery factor is 1.07, which is also greater than 1.  That is, the account recovers from drawdowns fast.  With the size of our account at $3000, the maximal drawdown at 11% is considered normal.

7.png

The test on a monthly period with the same parameters showed a profit factor of 2.06, but the recovery factor was 0.32.  With the size of our account at $3000, the maximal drawdown at 2% is considered normal.

Bottom Line

Now you know the working strategy with just one oscillator and candlestick patterns.  You should definitely try it out!

FBS Analyst Team

Share with friends:

Similar

Instant opening

FBS maintains a record of your data to run this website. By pressing the “Accept” button, you agree to our Privacy policy.