The Third Touch (also known as Third Strike) trading strategy requires only one element – a trend line.
Recommendations:
Apr 07, 2025
Strategy
The Third Touch (also known as Third Strike) trading strategy requires only one element – a trend line.
Recommendations:
You can implement the strategy on all trading instruments, including stocks and commodities.
Using this strategy on timeframes smaller than M30 is not recommended. The smaller the timeframe, the lower the possibility of a good signal because of the price noise.
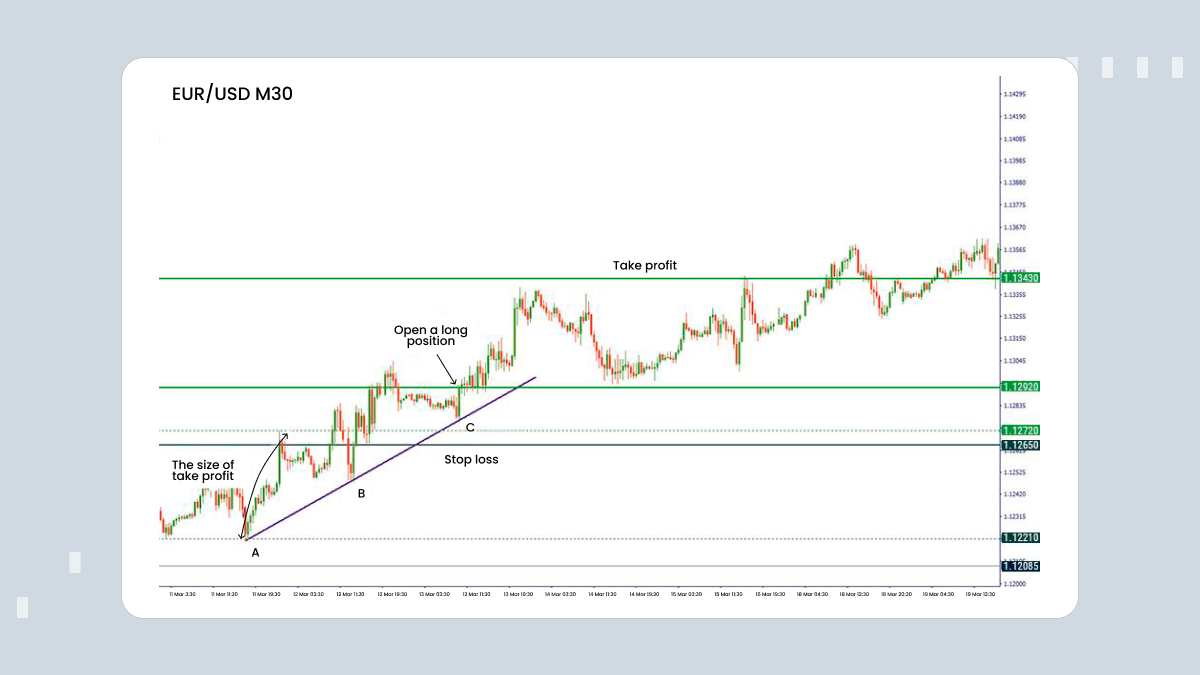
Here are the steps that you need to follow. First, let’s look at the scenario when you want to open a long position.
You see the upward movement and draw the trend line, which connects two lowest points. These points should ideally be the extreme points. This is the most difficult part of the strategy.
We wait for the correction to the downside and enter the market after the price touches the trendline for the third time and a bullish candlestick is formed. We open a long position at the closing price of this bullish candlestick.
We place a stop-loss below the previous support level.
Our take-profit level is calculated as follows:
The highest level after point A – the lowest level at point A = the number of pips you need to add to your entry level.
We will use the EURUSD chart with an M30 timeframe as an example.
On March 11, the pair started to move up. We waited for point B to draw the ascending trendline. After that, we waited for the third touch at point C and opened a position on the closing price of the bullish candlestick at 1.1292. We place the stop-loss level at 1.1265 (lower than the previous support). Our take-profit equals the size between point A (1.1221) and the highest point after point A (1.1272). Thus, we place it at 1.1343 (the entry point + (1.1272-1.1221).
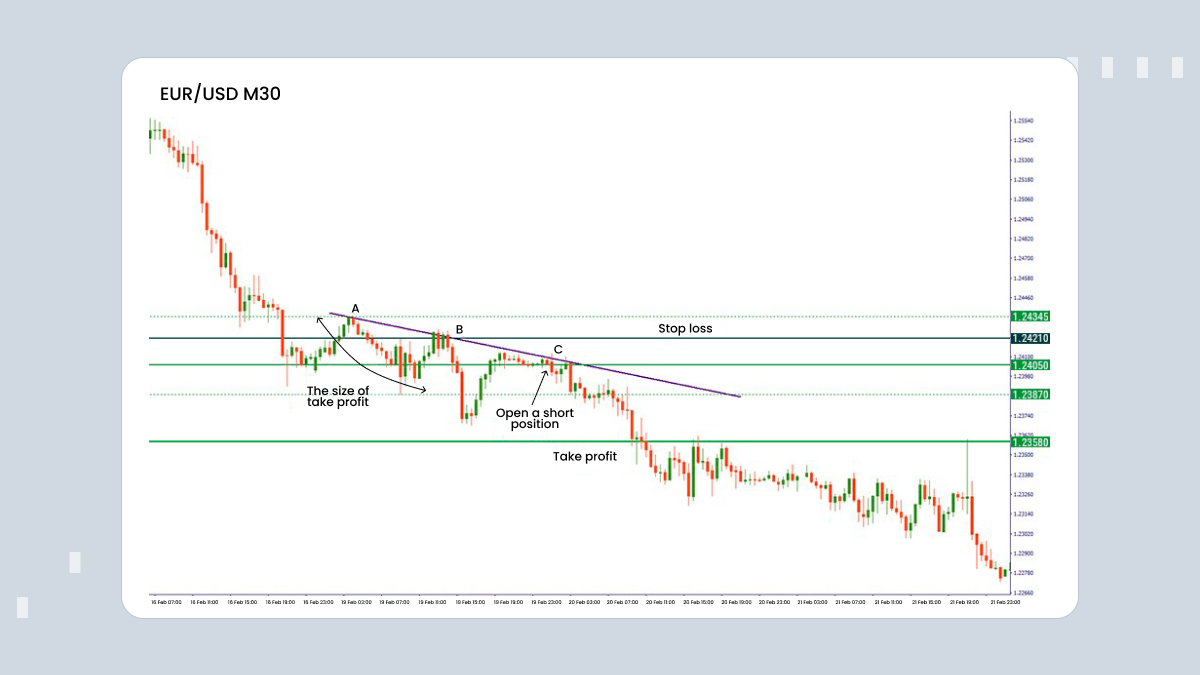
For the short position:
When the downward movement appears, you draw a trendline between two highest points.
After the second point of the trendline, we need to wait for the correction to the upside. Next, we wait for the price to touch the trendline for the third time. The short position needs to be opened at the closing price of the bearish candlestick formed after the third touch.
We place a stop-loss above the previous resistance level
Our take-profit level is calculated as follows:
The highest level at point A – the lowest level after point A = the number of pips you need to deduct from your entry level.
On February 14, the EURUSD pair bounced from 1.2434 and corrected to the downside. After a short-term correction, the price jumped to the upside but failed to move higher than point B. The situation helped us to predict the possible formation of a downtrend. We waited for point C to confirm our prediction and entered a short position after the bearish candlestick was formed. The entry was placed at the closing price of the candlestick at 1.2405. Our stop-loss was set above the previous resistance at 1.2421. The take-profit was calculated as the entry point minus the distance between point A and the lowest point after A: 1.2405- (1.2434-1.2387) = 1.2358.
Summary
In this article, we explained an easy-to-use strategy for trend traders. Its advantage is that it requires only one trendline, and the support and resistance levels. However, you need to be careful when trading pairs, and make sure that there are no events which may affect the movement of a trend.
By registering, you accept FBS Customer Agreement conditions and FBS Privacy Policy and assume all risks inherent with trading operations on the world financial markets.