
May 21, 2025
Strategy
The Turtle Trading System
“To be successful in trading, I need years of experience!”
If you think that, you probably haven’t heard of Richard Dennis - a commodities trader who trained a group of novice traders called “Turtle Traders,” and they made 100 million dollars in a short period. They proved that by following a simple set of rules even a beginner can earn a good sum of money.
Wait, “Turtle Traders”?
Like most genuine ideas, the plan to train non-skilled traders was born in a dispute between Richard Dennis and William Eckhardt, two American commodity traders. They were arguing about how important skills and experience were in trading. While Dennis believed that he could train people to become great traders, his friend Eckhardt thought genetics had more to do with good traders than training did. To solve this dispute, the two traders agreed to buy huge ads in Barron’s, the Wall Street Journal, and the New York Times, calling for participants. They selected 23 candidates and invited them to Chicago to trade with small accounts.
“We are going to grow traders like they grow turtles in Singapore”, - Mr. Dennis said.
That’s how the traders became called “turtles”. You might have encountered the “turtle” reference in the book “Street Smarts: High Probability Short-Term Trading Strategies” by Laurence Connors and Linda Raschke. Indeed, the authors developed a strategy called "Turtle Soup" based on the Chicago experiment.
Who are Richard Dennis and William Eckhardt?
Richard Dennis, known as the “Prince of the Pit” was a well-known commodities trader. Reportedly, he made $200 billion out of $1600 in about 10 years. In 1974, he became successful with trading in the soybean market and earned $500 000. He doubled that sum of money by the end of that year, turning himself into a millionaire.
William Eckhardt was his friend, and a founder of the alternative investment management firm "Eckhardt Trading Company,” which manages over $1 billion in managed accounts, and offshore as well as onshore products. A mathematician, he believed that a strong set of analytics and statistics is necessary to achieve great trading results.
Let’s look at the easy strategy these millionaires taught the Turtle Traders.
Rules of the Turtle Trading Strategy
What can you trade with this strategy?
The Turtles preferred to trade liquid markets. You can choose any major currency pair, commodity (oil, gold, silver) or even stock index futures (S&P500, DAX30).
What timeframes to trade on
To identify the perfect entry, traders had to trade on daily timeframes.
How to open a position
The magic of the Turtle Trading Strategy was based on a simple formula:
Trends + Breakouts = Profits.
Generally, the Turtles were trend-followers and breakout-observers. They opened a long or a short position after the breakout to the upside or the downside, and then kept their position open as long as the trend remained strong. As you may guess, they opened a long position on an upside breakout, or sold if there was a breakout to the downside. The turtles would go long or short whenever a breakout condition was implemented if it did not exceed their risk limits. There were two systems for entering the market.
1 – The short-term system based on the 20-day breakout.
The Turtles entered the market when the price broke the 20-period high or low. The breakout was confirmed with 1 pip above the 20-day high/low. The 20-day breakout entry was made only if the previous breakout failed. People tend to expect the same thing to happen again - this is called the “contrarian rule.” The stop-loss is a 10-day low for long positions and 10-day high for short positions.
2 – The long-term system based on the 55-day breakout
This pattern was traded when a trader followed larger market trends. If traders chose this pattern, they had to stick to the 55-day rule and always enter in case of a breakout.
When the Turtles traded, they opened a position with one risk unit. After that, it accumulated in equal units depending on the direction the trend moved. The risk units were the key element of the Turtles’ system. Let’s see how they worked.
Pay attention to position sizing
The traders adjusted the size of their position based on the volatility of an asset. The basic rule was: a trader had to choose the correct position size for a certain asset in dollar terms. Each position the Turtles held could be increased or reduced in so-called risk units. Mr. Dennis provided the Turtles with a formula that helped to identify the number of risk units. It was based on the calculation of N, which represented the volatility of a particular market. It was the 20-period average true range (ATR).
Let’s use the example of GBPUSD to see how it was calculated.
For September 5, 2019, the ATR value for GBPUSD was 0.0104. This is our N. That means that the average daily movement of GBPUSD is 104 pips. Let’s convert that to USD. With a contract size of $1000, we will have:
Dollar Volatility = 0.0104 x 1000=$10.4
If the quote currency is not USD, then it has to be converted to USD.
The Turtles always adjusted their positions using equal "risk slices" known as units. One unit represents 1% of the risk. For example, with an account of $10 000, one unit has a monetary value of $100.
So, let’s calculate how many contracts the Turtle Trading System requires for trading GBPUSD:
Unit size = $100/$10.4 = 9 contracts.
So, for trading GBPUSD the turtle system would trade in multiples of 9 contracts for this type of account size.
Growing a position
If the conditions allowed, the Turtles grew their position to a maximum allocated risk. This again was based on the volatility and calculations of N. The Turtles grew their positions in increments or half increments of N or ½ N.
Stop-losses
The Turtles followed very strict rules on stop-losses. They also calculated it based on the N measure. The 2% rule was used to limit risks. Therefore, if the position moved against a trader by more than 2N, it was always closed. They also trailed stop-losses.
Limit orders are better than market orders
The students of Richard Dennis were instructed to use limit orders instead of market orders. This way, the orders were expected to fill at a better price than the current market.
Exits
Placing perfect take-profits was hard for the Turtles, as they were afraid to miss good price movements. According to their rules, if a trader holds a long position and the price starts to go down, they should exit at the 10-day low. Alternatively, if a trader holds a short position, and the price starts to rise, they should exit at the 20-day high.
Example of a trade
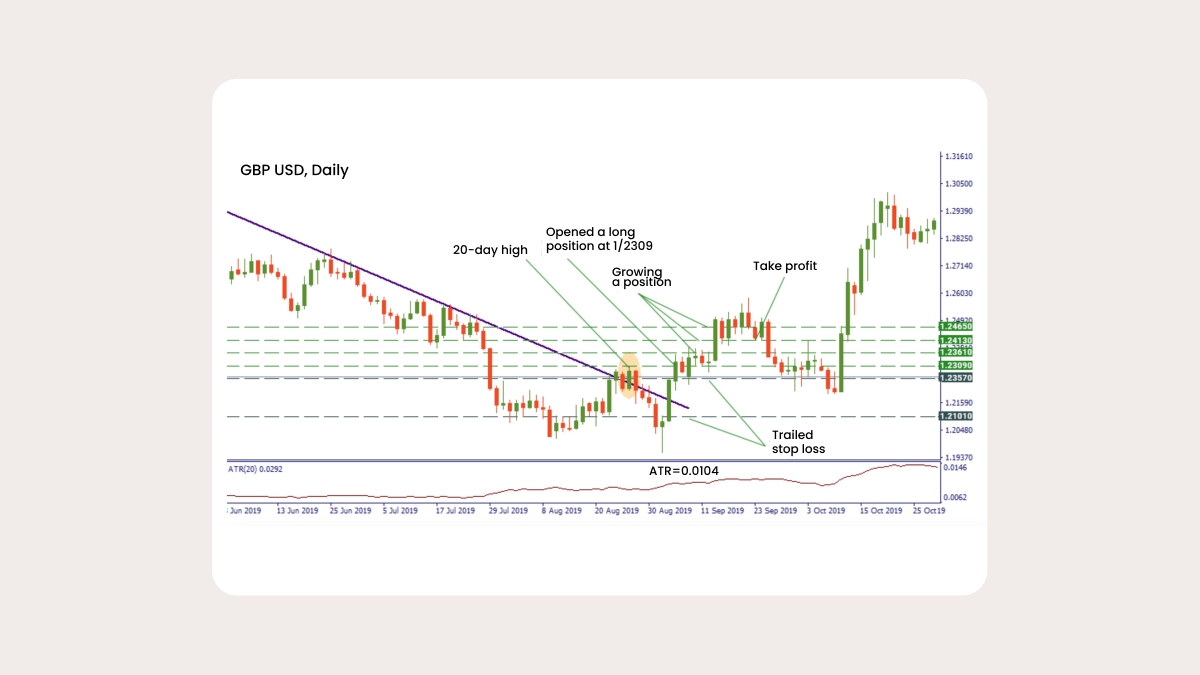
Let’s consider the short-term system. We will take the GBPUSD chart as an example. As we can see below, the price has been moving within a downtrend. The price broke the descending trendline on the 4th of September and reached the 20-day high on the next day. The 20-day high was the 1.2308 level. Thus, we opened a long position at 1.2309 (1 pip above the high). After that, we pointed out where we needed to add to our initial position. With N equaling 0.0104, we had the following measures:
+1 unit: 1.2309 + 1/2 x 0.0104 = 1.2361
+ 1 unit: 1.2361 + 1/2 x 0.0104 = 1.2413
+1 unit: 1.2413 + 1/2 x 0.0104 = 1.2465
At the prices above, we added units (opened more positions). In the beginning, our stop-loss was placed at 1.2309 - 2 x N = 1.2101. But we trailed it as we opened more positions. The last one was placed at 1.2257.
After rising for several days, the price started to pull down. When it fell below the 10-day low at 1.2412, we closed our position.
What else may help?
It may be hard to wait the 20 days for the price to reach a certain point. As a result, you may enter the trade and exit too early. Luckily, on the official MT site, you can find a link to the Turtle Trade indicator, which counts the days for you and helps to identify the correct entry.
Summary
The Turtle Trading Strategy was revolutionary at the time of the experiment and showed that traders don’t need any skills to earn money on trading. Still, you must stay patient, and wait for as many confirmations as possible. The markets tend to be choppier right now than in the XX century, so you always need to make reasonable investment decisions.
Open an FBS account
By registering, you accept FBS Customer Agreement conditions and FBS Privacy Policy and assume all risks inherent with trading operations on the world financial markets.