Struggling to choose between part-time and full-time trading? Then this article is for you!
Moving Average: sacred crossing
2023-01-25 • Updated
Foundations of technical analysis
There is a great multitude of instruments in technical analysis. But this is not due to the variety of ways how they are technically composed or different nature of processes they represent. Rather, that is due to a number of minor specific features that were added to the same mathematical predicaments. Eventually, they produced a variety of instruments that may have different names but in the core have the same or similar functioning.
The chart below breaks down technical analysis into three clusters, among which “Indicators” is what we need. Normally, traders are pretty obsessed with indicators, be it just one specific indicator or a number of them. That is due to a psychological reason: offering a plausible explanation of a barely understood market performance, an indicator lures traders into believing that it may also predict where the market goes. While that is true quite often, the problem is that one cannot really know when exactly an indicator will be correct or falter. A false signal is a fundamental enemy of every indicator, and it knows no exception.
Moving
Sacred crossing
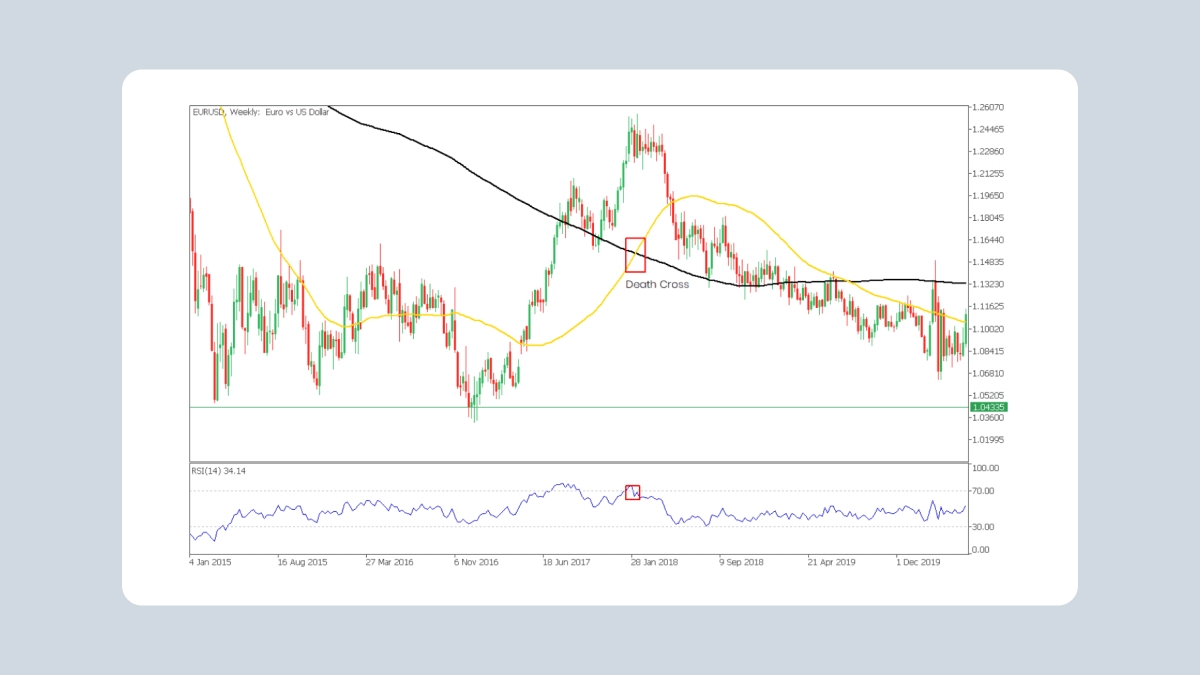
In the meantime, one of the most spectacular technical tools is MAs crossover. As it is more appropriate for long-term observations, it does not appear that often. But if it does, it may be a harbinger of dire events to come. In hindsight, the US stock market disasters of 1929, 1938, 1974 and 2008 could have been effectively foreshadowed by this death cross. Therefore, someone in possession of such an instrument those times would be able to earn six-digit sums opening trades in view of this indication. Maybe someone did in fact, we just don’t know. So what is this “death cross” actually? And how does it work?
Inner working
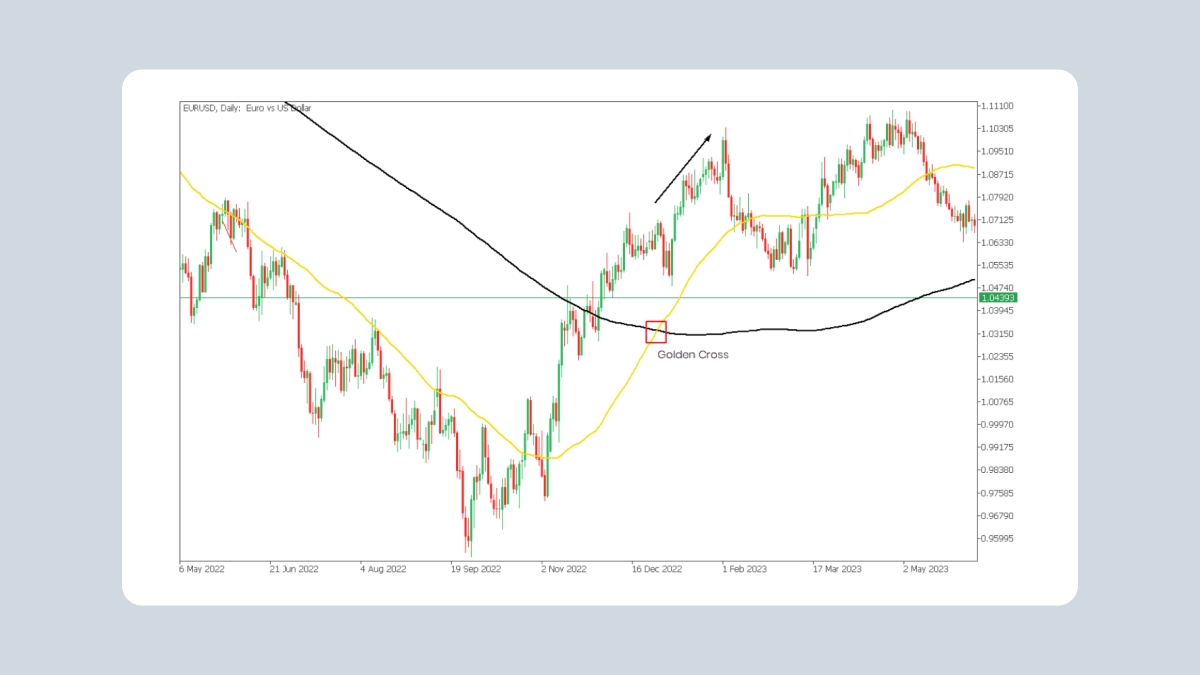
There are two types: bearish “death cross” and bullish “golden cross”. Both have the same composition: a short-term and a long-term moving average. When the short-term MA crosses the long-term upside-down, that’s a bearish indication; when the short-term crosses the long-term bottom-up, that’s a bullish signal.
Normally, a short-term moving average is taken as 50-MA, and the long-term is 200-MA. But it may vary from strategy to strategy. There are those which take 16- or 26-MA as opposed to 350-MA.
The logic here is the following. A short-term moving average is closer to the actual price movement. It merely removes the market noise from the presentation of the price performance. So instead of looking at a chaotic sequence of up- and downswings, you have a pleasing view of a smooth curve of a short-term moving average. The long-term moving average doesn’t represent the price increments; instead, it shows a strategic change in the levels the price was resting at across months and years.
Hence, a short-term MA set against the long-term MA is the actual and recent price movement measured against the strategic picture. The supposition is that if the recent price moves go too far away from the historical view, that means something really serious is happening in the market and there is a potential for a big change. If the short-term picture is significantly better than the long-term – meaning, if the short-term MA crosses the long-term bottom-up – the market should have a considerable bullish potential that is waiting to be unleashed. Otherwise, if the historical dynamics take higher ground compared to the current moment - for example, 50-MA crosses 200-MA upside-down – then the bears are believed to be preparing for war.
Taken alone, the logic is pretty straightforward, and from the application point of view, easy to use. You just plot the MAs on the chart, watch them cross, and act accordingly. But how reliable is this method in general? What’s the probability?
Fat chance
In the table below, we took 10 public companies from various fields. Observing the daily chart for 2018 and 2019, we counted the total number of 50-to-200-MA crossings. After that, we counted the number of “correct predictions” made by these crossings in the mid-term. That means, we just observed if indeed the price went upwards in the mid-term after a “golden cross” and downwards after a “death cross”.
As you can see, out of 30 total 50-to-200 MA crossings across 10 companies during the years 2018-2019, only 11 were fruitful. In other words, relying on this method alone, a trader would have roughly a 33% chance of winning which seems quite dull. Indeed, technically, that means a trader would rather lose money relying on this instrument. What’s the problem with it then?
Time
The problem is that the moving averages crossing method is based on the performance of the moving averages. And the moving average is a lagging indicator. That means, once the price makes its move, the moving average will react to it only later on; the shorter term it has, the quicker it will react. So strictly speaking, any step of a moving average is a reflection of a step that the price had made a while ago. That ”while ago” is pretty crucial.
First, it takes time to catch the moment where 50-MA and 200-MA cross. But as a reasonable trader, you don’t rush into action just the moment you see them cross. You wait for them to stay where they are and time-confirm the observed disposition. Second, it takes time to open a trade: to place stop-loss, take-profit, and buy/sell level. And third, it takes time to close the position, and if you follow the common practice of using the 50-MA and 200-MA, you will go for the daily chart – that means, you will have your position closed a few days after. So from the moment of seeing the moving averages cross to the moment when you close your trade, it may take quite a while. And during that time, the forces that drove the market to make the 50- and 200- MAs cross may already exhaust themselves and reverse. That means the moment when your order gets closed may take place at the moment when the market is long moving in the opposite direction.
Therefore, this is a timing problem. And it has a partial solution which is: you may well use the “death/golden cross” method quite effectively, but not in time of strong fluctuation and not with volatile trade instruments.
It’s quite logical: you have to choose those stocks or currency pairs, that don’t switch their mood too often, and if they do, they do it “once and for all”. If that’s the case, you will have a good chance that while you observe the MAs crossing, set your trade and finally close your position, the market still would be going where it was when you first noticed the “death/golden cross”.
Also, an additional solution is to minimize the time of keeping your position open. By doing so, you will minimize the risk of seeing your stop loss hit because the market already changed direction. That implies that you humble yourself with extracting maximum profit: we all tend to extend our positions to extend our profits, but more often, we get penalized for such greed. Therefore, moderation is rewarded.
Example
The daily chart below shows the price performance of HP stock at the end of 2018-beginning of 2019.
Point A shows a clear “death cross”. But it is clear only in hindsight as we are looking at it from a very distant moment in the future having the whole picture. If you are there in that exact moment of crossing, you only see the 50-MA making an angle with the 200-MA, and that alone doesn’t warrant any action.
In real life, unless you are an outrageous risk-taker, you just don’t act at point A but make yourself a reminder to get back to this chart in a while to verify that the trend indeed goes down.
That is exactly when point B comes. You see the chart, you see the price making a dip to $19.20 and then getting up to $21.50. Also, you see the increasing gap between the 50-MA and 200-MA after they formed the observed “death cross”. Accordingly, you think: “Ok, we have the death cross, strategic trend down, and a local correction upwards; I sell here because this correction ends soon, and I will see the trend go further down – there I will see”. So you sell on January 10. And until February 28 you see nothing else than a steady rising. Point C: you lose your funds, curse the moment you saw that “death cross” and decide to never use this method again.
Later on, you open the daily chart of HP just by chance – and that is only to discover that the price eventually did go down to the area of $19.20 and even below. That is where closing the position was supposed to take place. But it would take you literally months to get there.
This example is quite controversial. On the one hand, the “death cross” did present a correct prediction – the price eventually collapsed. But how practical was that correct scenario (which is just 33% of all cases) for a trader who isn’t willing to keep positions open for months paying the swap?
Foreseeing
That brings us to another, a rather fundamental problem with this method. Moving average is an indicator reflecting what happened already. Taken alone, in no way it may predict what takes place the next moment.
In the observed scenario, technically, the “death cross” in point A appears as a result of an earlier collapse of the price from above $24 per share down to the area of $21.50 and below – this drop is exactly what forced the 50-MA to bend down to cross the 200-MA.
Thinking like “ok, I see the death cross – that means, the price will drop further on” is a fallacy. A correct consideration should be “ok, I see the death cross; that should mean there are strong bearish forces in the market which may keep forcing the price downwards further on”. The former artificially links an observed visual phenomenon (“death cross”) to a desired outcome (price continuing to fall). The latter interprets the observed visual phenomenon (“death cross”) as an indication of certain inner workings (“bearish forces”) of the market and makes a presumption (only!) that those inner workings may extend their effect into the nearest future.
This presents an excellent example of the difference between a “light-mode” trading and a learned way to make profits. Needless to say, if you take it lightly, your profits will be also light.
If you want to have serious profits – be serious about indicators and market interpretations.
It doesn’t take much, but it does require being what, why and when you do. An example below is a good visualization of that.
With the same HP, looking at the daily chart, being in point-B moment of time, you will notice the “golden cross” in point A and will be correct to buy. If you opened longs at $21.50 at that moment, you would see the price rise straight to $23.50 – that’s almost 10%. Not bad for approximately a month of waiting, taking into account that only a mild correction downwards took place just barely below the same $21.50. But here comes the choice: if at $23.50 you said “ok, that’s enough of waiting and enough of profit for me” and closed your position, you would win this game. If you thought “no, I’ve waited this much and I deserve much more to gain”, then you would see the price get down to $14.41 where it is now losing everything.
Takeaway
You will be right to note that in fact none of the examples above presents an unambiguously successful case. In each one, time defines whether your trade would be profitable of disastrous to your funds. That reflects well the nature of things – taken alone, the MA-s crossover is not enough to be a basis for decision-making. If you see a clear “death cross” or “golden cross”, don’t rush into opening a trade. Check other timeframes, other indicators (especially, oscillators as they complement the trend indicators), verify with fundamentals and news on the considered asset. Also, follow common sense.
In the end, this is just two lines crossing each other. Whether it will be a meaningful element of a larger system of a consistent trading strategy – depends on you.
Similar
In trading, we can rely on a bunch of different entry signals.
A triangle chart pattern is a consolidation pattern that involves an asset price moving within a gradually narrowing range.
-
How to start trading?
If you are 18+ years old, you can join FBS and begin your FX journey. To trade, you need a brokerage account and sufficient knowledge on how assets behave in the financial markets. Start with studying the basics with our free educational materials and creating an FBS account. You may want to test the environment with virtual money with a Demo account. Once you are ready, enter the real market and trade to succeed.
-
How to open an FBS account?
Click the 'Open account' button on our website and proceed to the Trader Area. Before you can start trading, pass a profile verification. Confirm your email and phone number, get your ID verified. This procedure guarantees the safety of your funds and identity. Once you are done with all the checks, go to the preferred trading platform, and start trading.
-
How to withdraw the money you earned with FBS?
The procedure is very straightforward. Go to the Withdrawal page on the website or the Finances section of the FBS Trader Area and access Withdrawal. You can get the earned money via the same payment system that you used for depositing. In case you funded the account via various methods, withdraw your profit via the same methods in the ratio according to the deposited sums.