Strategy 1
For example, suppose we have decided to trade the CADJPY currency pair.
Canada is one of the world’s largest oil-producing nations and a well-known exporter of this commodity. So, the Canadian dollar normally rises when oil prices go up. In contrast, Japan is considered to be a net oil importer. This causes the yen to weaken when oil prices gain. This situation makes the dynamics of oil prices a leading indicator for the movement of the CADJPY currency pair.
Strategy concept:
Timeframe – daily
Long trade setup:
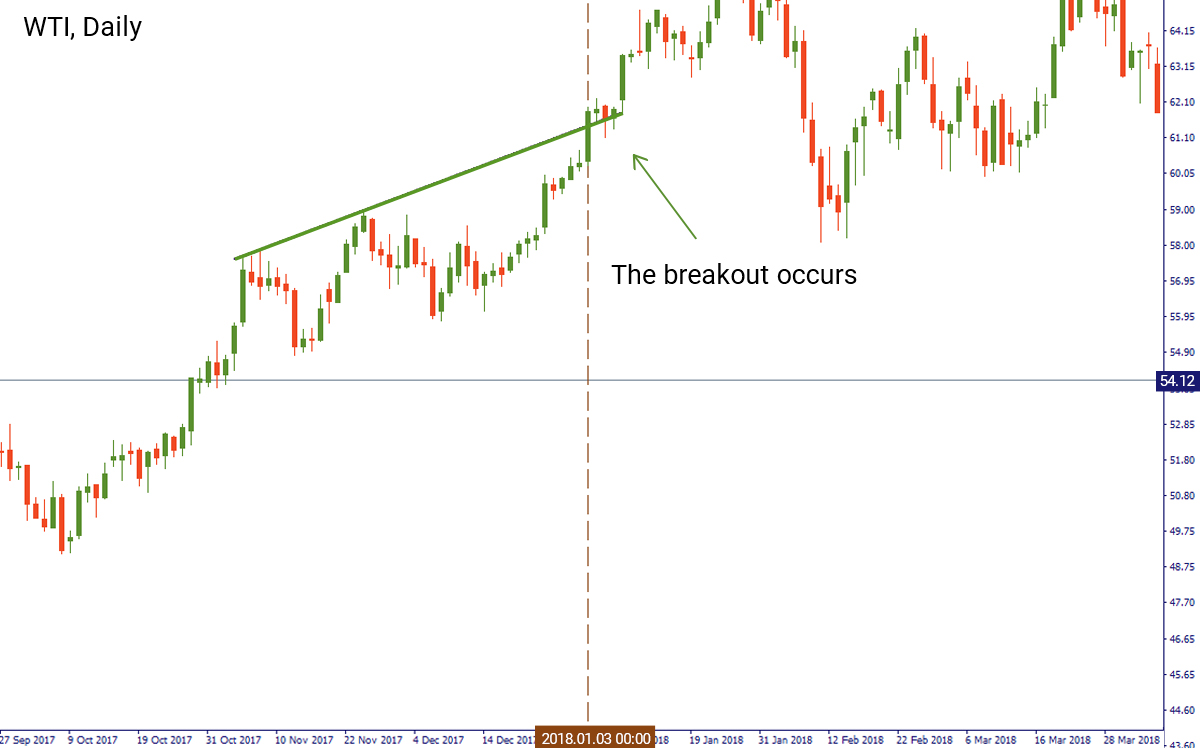
First, identify the resistance on the daily technical chart of oil futures.
Find a candlestick that closes above the resistance.
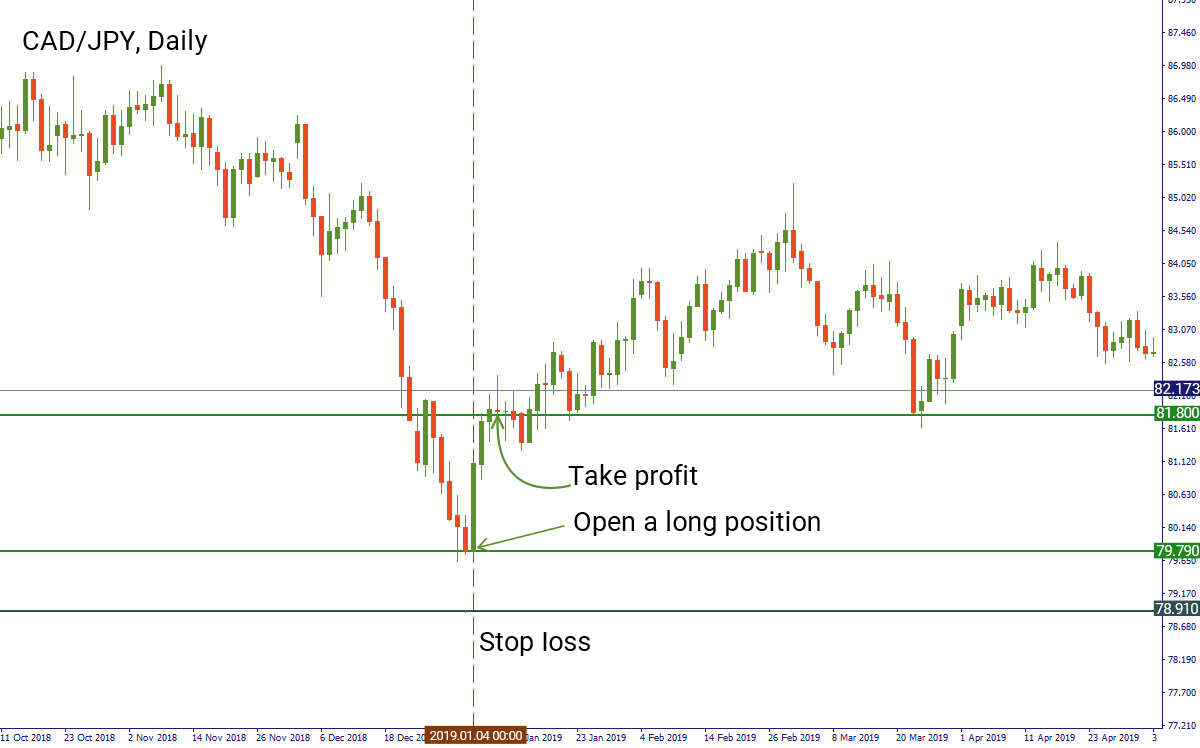
Open a long position on CADJPY as soon as the next candlestick opens.
Place a stop-loss at the significant support level before entry.
Set a take-profit below the next significant resistance level after the entry.
Example:
On the daily chart of WTI, we identified an uptrend and were looking for a breakout of it. The candlestick which closed above the trend line occurred on January 3. After that, on January 4, we opened a long position for CADJPY at the opening price of a candlestick at 79.79. We placed a stop-loss at the previous support level at 78.91 and a take-profit at 81.8.
Short trade setup
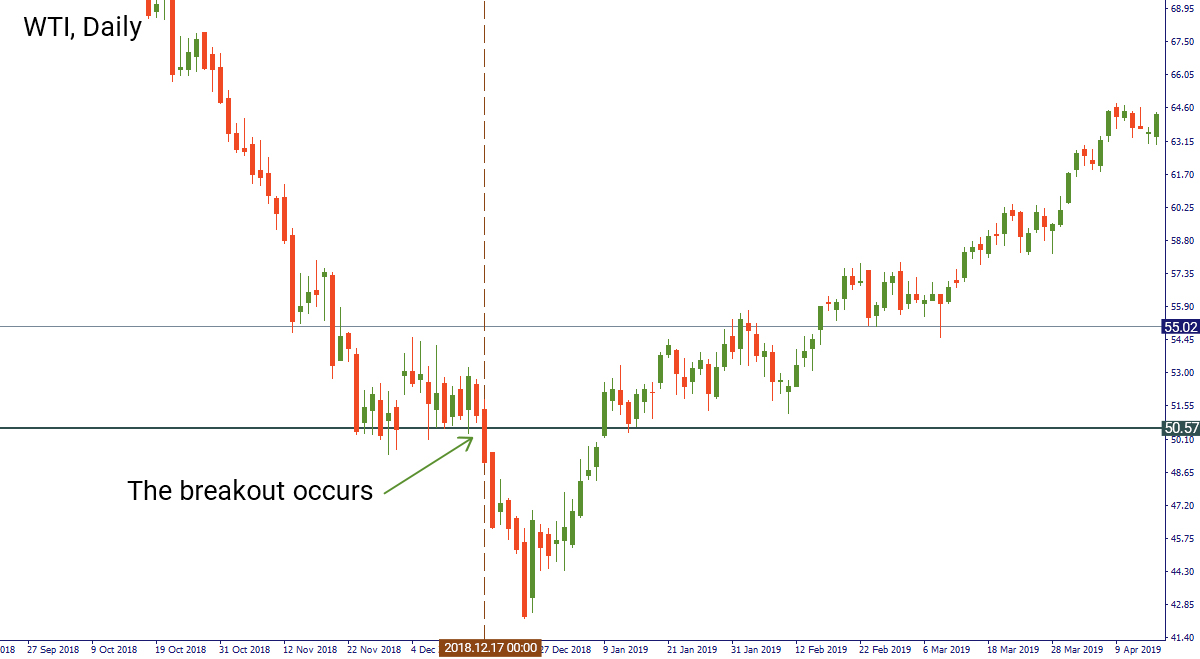
Identify the support of the oil chart on the daily timeframe.
Find a candle that closes below the support.
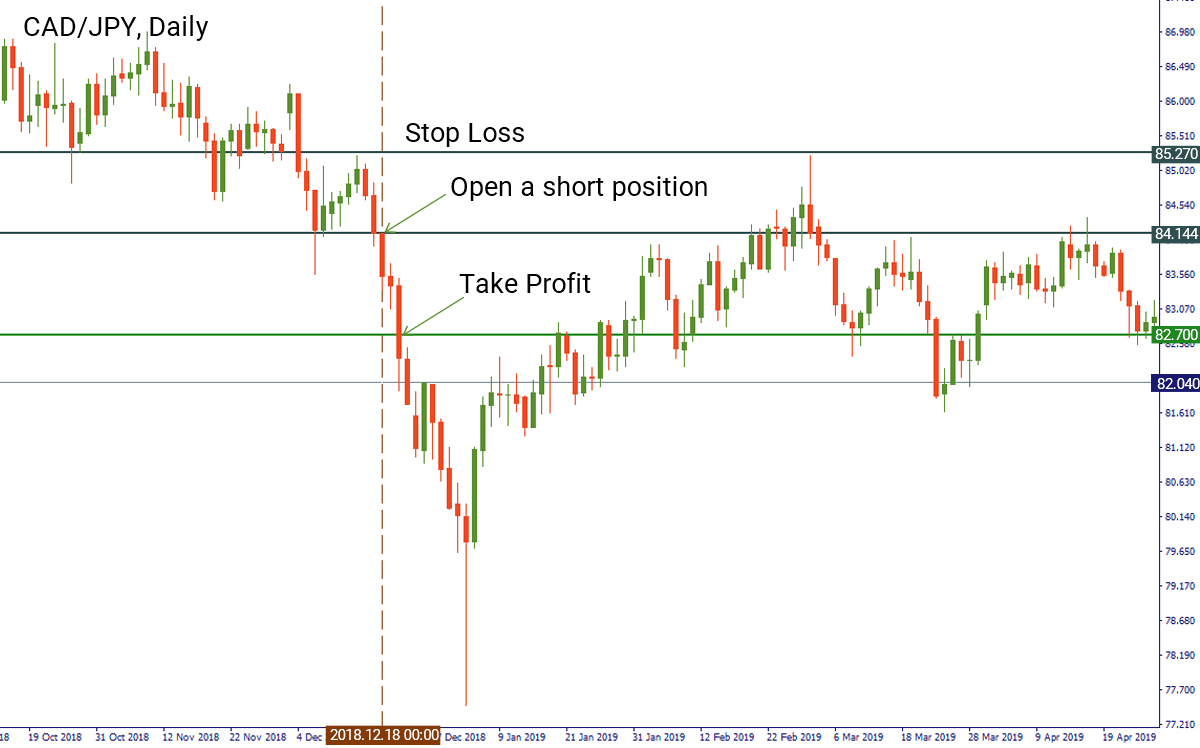
Open a short position on CADJPY at the opening of the next candlestick.
Place a stop-loss at the significant resistance level before entry.
Set a take-profit below the next significant support level after the entry.
Example:
On the daily chart of WTI the price of crude has been consolidating above the support level at $50.57. We waited for a breakout of this level, which happened on December 17. After that, we switched to the chart of CADJPY. We placed a short order at the opening price of the candlestick on December 18 at $84.14. The stop-loss for this position will be situated at $85.27, while the take-profit goes at $82.7.
Strategy 2
The strategy that we are going to describe here explains the negative correlation between the US dollar index (the index measuring the value of the USD relative to the value of a basket of major currencies) and the price of gold. As a rule, the US dollar index falls when gold rises.
Strategy concept:
Timeframe – daily
Long trade setup:
Identify the support level on the US dollar index chart (daily timeframe).
Identify a candle that closes below the support.
Open a long position on the gold chart at the opening of the next candlestick.
Place a stop-loss at the significant support level before entry.
Set a take-profit below the next significant resistance level after the entry.
Example:
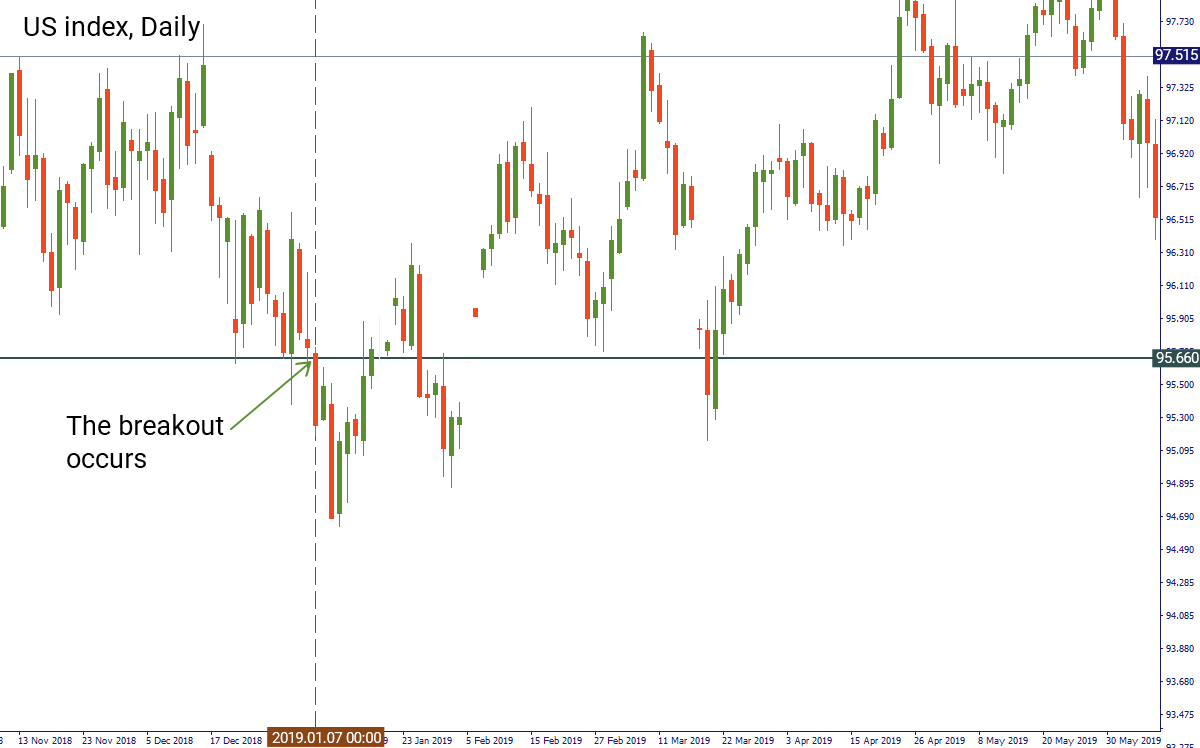
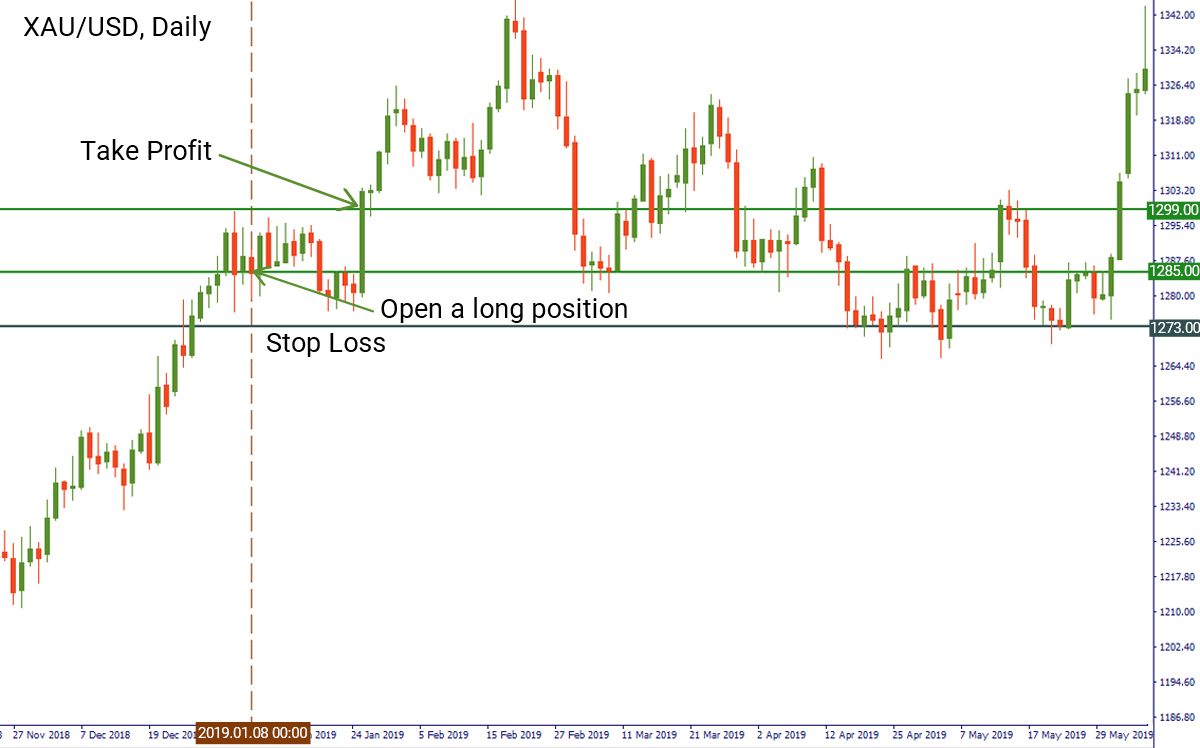
On the daily chart of the US dollar index, we noticed the breakout of the 95.66 support on January 7. After that, we opened the gold chart and entered a long position at $1285 on January 8. We placed the stop-loss at the previous support level at $1273. The take-profit level was at $1299 (a little below the resistance level).
Short trade setup:
Identify the resistance on the US dollar index chart (daily timeframe).
Identify a candle that closes above the resistance.
Open a short position on the chart of gold at the opening of the next candlestick.
Place a stop-loss at the significant resistance level before entry.
Set a take-profit below the next significant support level after the entry.
Example:
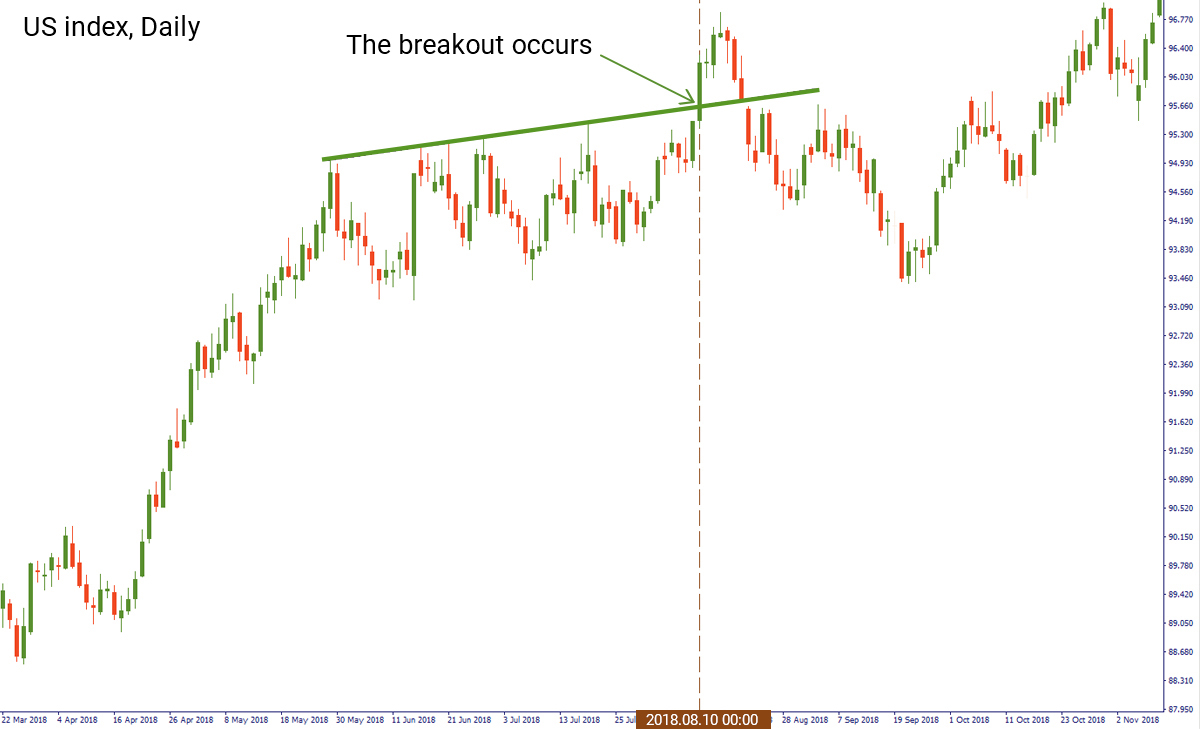
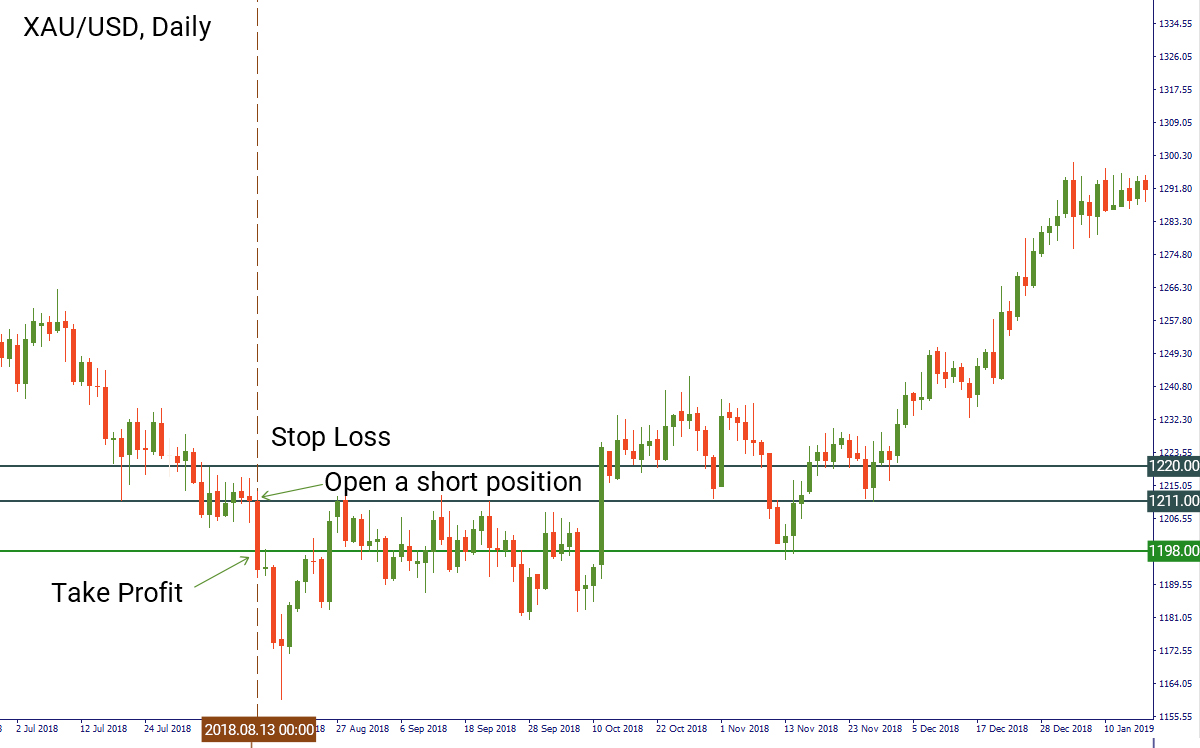
The situation when you need to open a short position is similar to the scenario with a long one. On August 10 (Friday), we identified a breakout of the resistance on the daily chart of the US dollar index. We switched to the chart of XAUUSD and entered a short position at the opening price of the candlestick on August 13 (Monday) at $1211. We put the stop-loss above the first resistance level before entry at $1220. The level of take-profit was at $1198 (close to the support level).
Summary
Understanding correlations and fundamental analysis makes it easier for a position trader to catch the market’s movement and open a position at the right moment.