Escenario bajista: Ventas por debajo de 18100 con TP1:17900, TP2:17814 y 17630 // Escenario alcista anticipado: Compras intradía sobre 18130 con TP: 18219, TP2: 18270 y TP3: 18428
Bullish USD/CAD is held by daily resistance
2019-11-11 • Actualizada
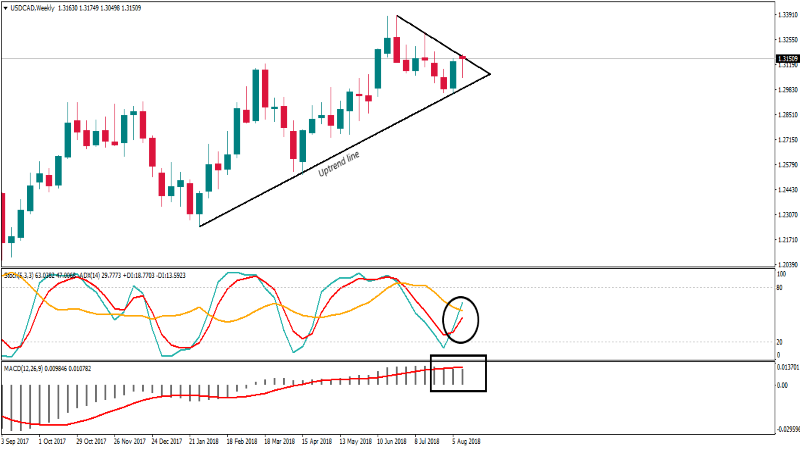
At the end of this week, USD/CAD pair is still in the bullish zone. Since the beginning of this year, the pair has been trading in an upward trend. On the weekly timeframe, it was possible to see that the USD/CAD movement was held back by a minor downtrend. The Stochastic indicator made a positive cross, although on the MACD histogram indicator went below the signal line.
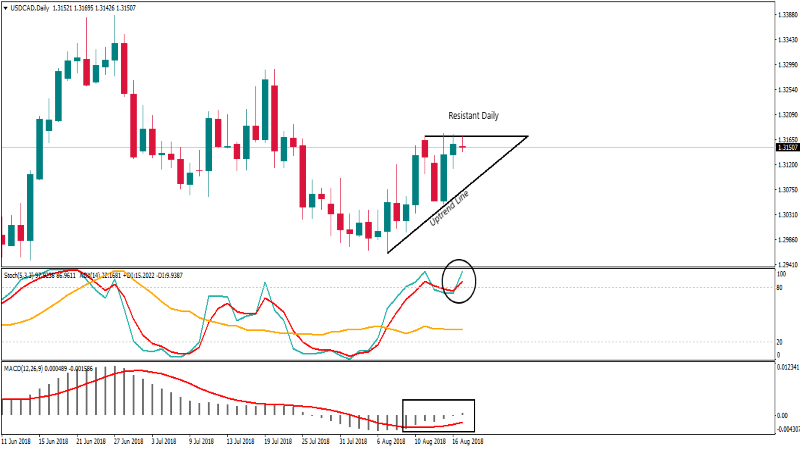
On the daily timeframe, USD/CAD is also still in an uptrend, but stuck to the daily resistance level. The Stochastic indicator has crossed back up and the MACD histogram remains above the signal line.
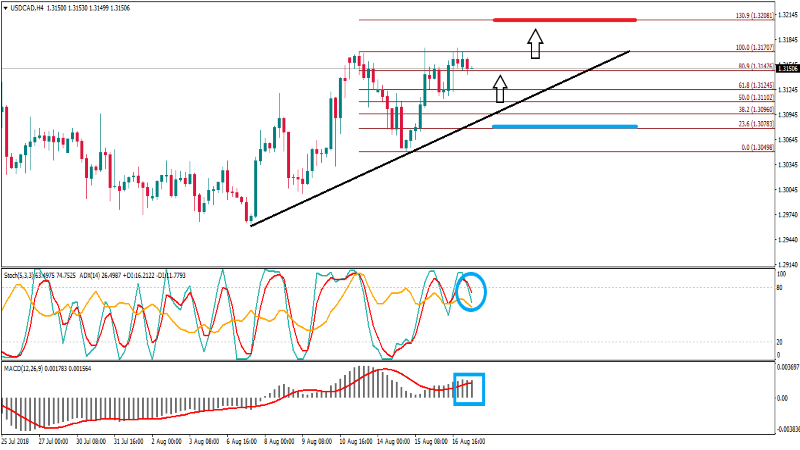
On the H4 timeframe, USD/CAD is also still in an uptrend, but the Stochastic indicator has crossed down and the MACD indicator shows a possible correction of USD/CAD down to 1.31102 (Fibo 50.0% H4).
The upside target for the pair is at 1.32081 (Fibo 130.9% H4), and the support level is at 1.30783 (Fibo 23.6% H4).
Similar
Escenario principal: Compras sobre 15346 con TP: 15480 con S.L. por debajo de 15310 Escenario alternativo: Ventas por debajo de 15300 con TP1: 15227 y TP2: 15145
Los 6 principales eventos fundamentales en la actualidad y la perspectiva técnica para el DXY y los Índices Bursátiles de EE.UU
Últimas noticias
Escenario bajista: Ventas por debajo de 1.0820 / 1.0841... Escenario alcista: Compras sobre 1.0827...
Escenario bajista: Ventas por debajo de 2200 / 2194... Escenario alcista más próximo: Compras sobre 2197... Escenario alcista tras retroceso: Considera compras en torno a cada zona de demanda...
Escenario bajista: Ventas por debajo de 5220 ... Escenario alcista: Compras sobre 5225 (Si el precio falla en romper por debajo con decisión)