Introduction
A fast-paced financial market requires a careful analysis of trends and market changes within the full scope of the investment world.
Experienced traders and beginners alike should always do their best to make well-informed decisions to counterbalance the inherent risk of the market. Candlestick charts are a powerful tool that helps you visually understand what’s happening, and maybe more importantly, get an idea of what might be coming next.
Lots of insightful patterns appear on those charts. In this article, you’ll get an overview of a very relevant one: the Marubozu candlesticks. They represent a strong sense of market confidence and can help traders get ahead of trend reversals or trend continuations.
What is a Marubozu candlestick?
A Marubozu candlestick is a famous formation found in financial charts. Visually, it has a very long body with no wicks or shadows at the top or bottom.
What this means is that within the chart’s timeframe, the price didn’t vary outside the prices of the trading session. The asset opened and closed with a specific price and didn’t go further than these numbers at any time.
With this lack of variation, the interpretation is that the market was decisive about the asset. It represents a strong market momentum, visually suggesting: “There’s no doubt about this, we should only buy or sell it.”
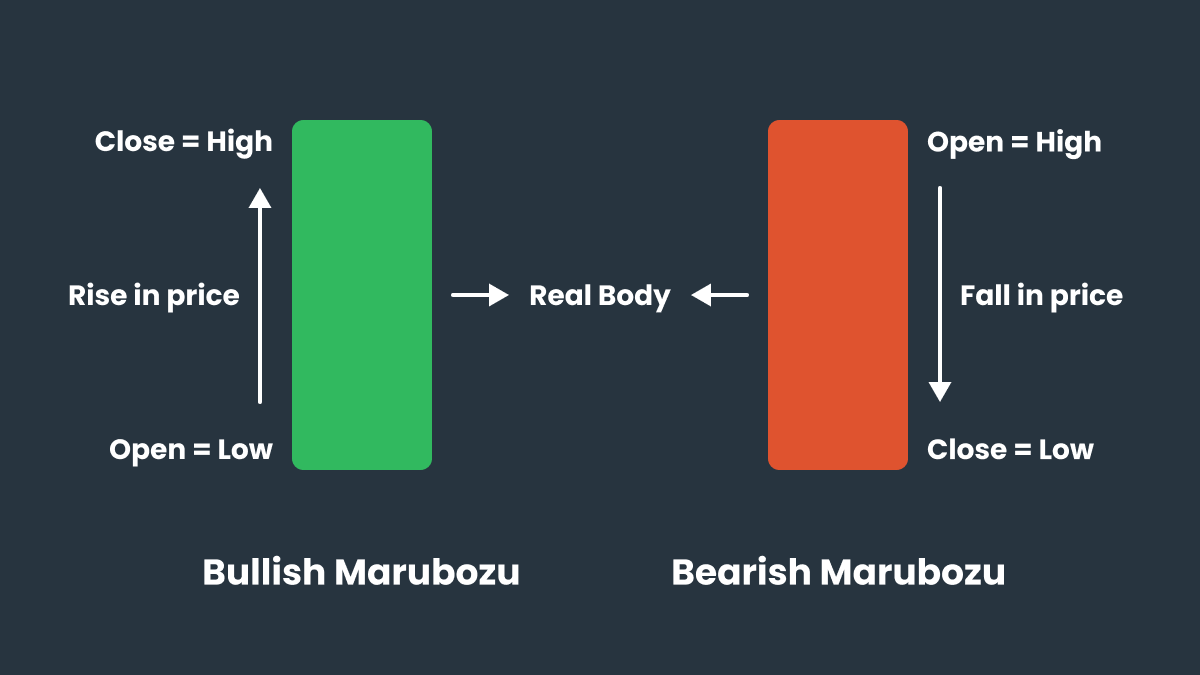
As with many other chart patterns, we have two types of Marubozu candlesticks: bullish Marubozu and bearish Marubozu.
With the bullish Marubozu, the price opened low and closed high, with no variations outside these minimum and maximum numbers during the trading session. This candle is usually represented by a green or white color and shows that the bulls controlled the market during the whole time.
On the other hand, with the bearish Marubozu, the price opened high and closed low, also without price variations outside these limits. This candle is usually red or black and shows that the bears controlled the market during that session.
Understanding candlesticks and their charts
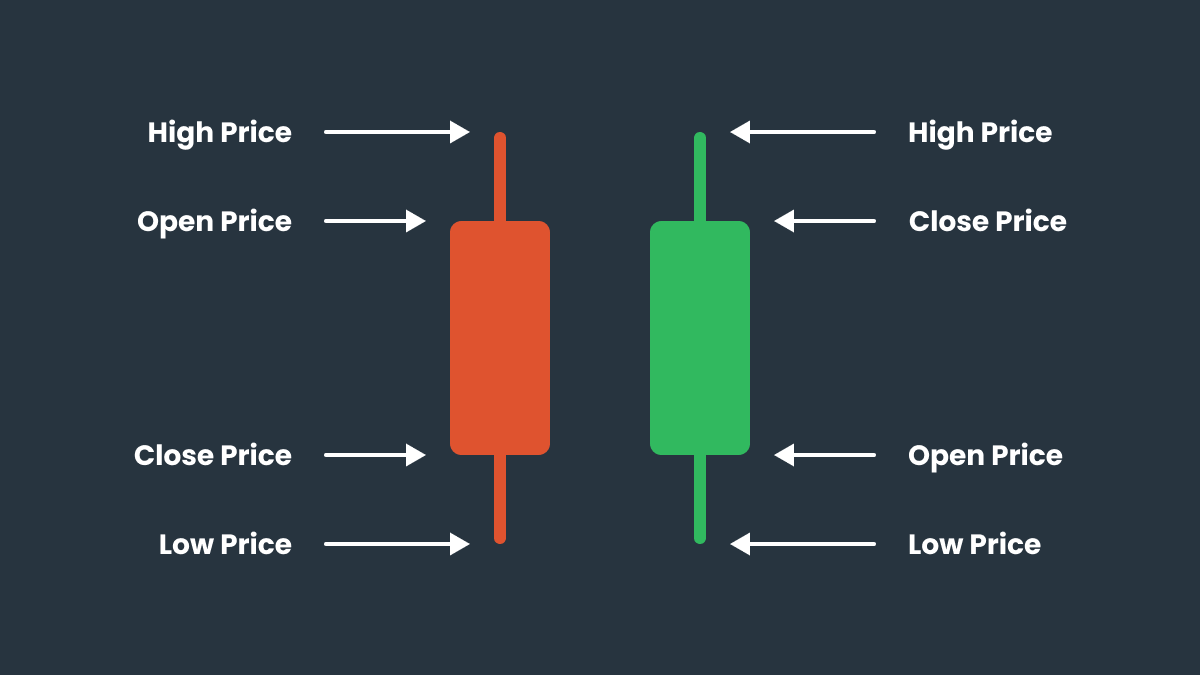
Candlesticks can come in many forms, but the core concept is that they show the full scope of an asset’s price variation during a selected timeframe: the body represents the open and close prices, and the wicks or shadows represent the highest and lowest prices achieved during the selected period.
If the price grew during the analyzed period, or if it opened low and closed high, we have a bullish green candle. If the price decreased (opened high and closed low), we have a bearish red candle.
A simple example: during a daily trading session, the stock of imaginary company Z opened costing $10 and closed costing $15. During that day, the highest price was $20 and the lowest price was $5.The body of the candle would represent the numbers 10 and 15, and the wicks would represent the numbers 5 and 20. This would be a bullish green candle in the chart.
If you put together all the daily candles within a 3-month chart, for example, you would be able to see the price history of an asset for that period. This is what we call candlestick charts and they are a key tool in trading.
Within that concept, many candlestick patterns appear repeatedly in those charts. Traders and financial analysts study these patterns to predict price movements and get a better understanding of market psychology.
The psychology behind Marubozu candlestick patterns
Within the realm of candlestick patterns, Marubozu candles are considered a really important one by financial analysts. The reason is that they can demonstrate a strong sense of market direction, representing total dominance by buyers or sellers.
When a Marubozu candle appears, it’s a clear sign that there’s no doubt in the market during the analyzed period: the market is either buying the asset or selling it, making the price go higher or lower without hesitation. That’s why there are no wicks or shadows: the price changes in one direction with confidence and just keeps going.
Therefore the appearance of a Marubozu candle is a visual representation of a strong market sentiment, either bullish or bearish, that can signal trend reversals or trend continuations, depending on the situation.
How to spot Marubozu candles
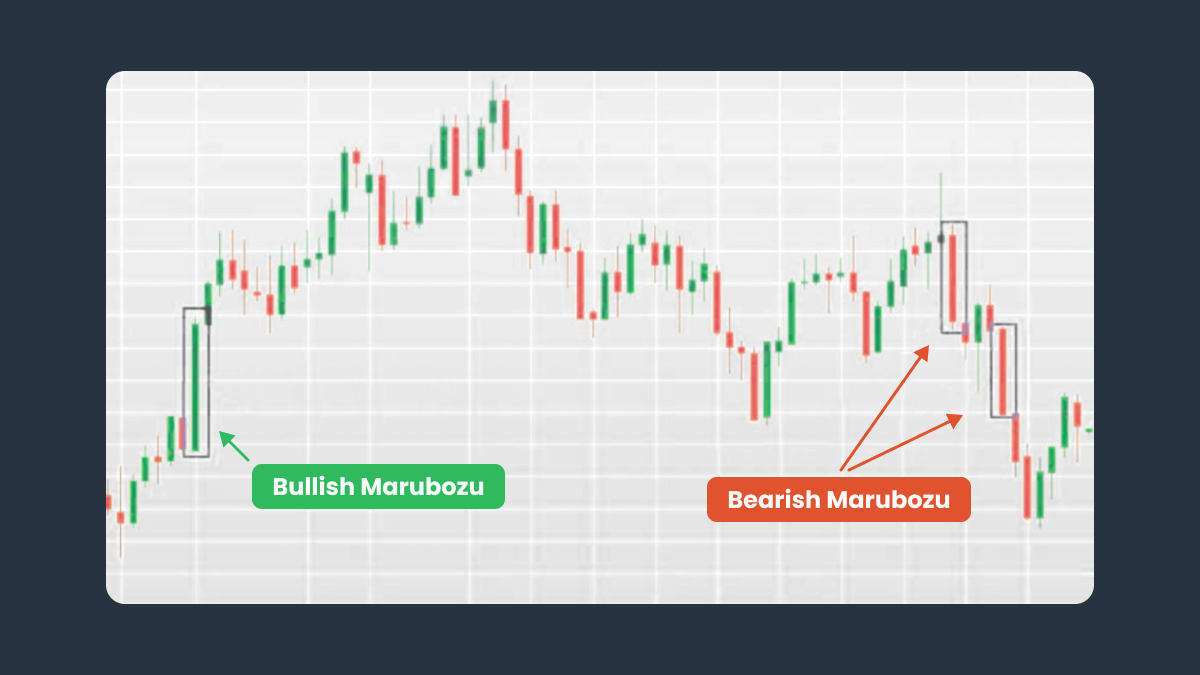
Marubozu candles are fairly easy to identify in the charts. Here’s what you should be looking for:
No wicks or shadows. The candlestick is just a full tall rectangular shape, with no lines coming out of each side. If the wicks or shadows are there, but they are minimal, the pattern is still valid.
Matching prices. The opening and closing prices match the highest or lowest price, depending if the candle is bullish or bearish. Perfect matching is rare, so very minimal wicks don’t invalidate the pattern.
Longer body. Marubozu candles have larger bodies compared to other candles because the price is moving consistently in one direction without much retracement.
In summary, Marubozu candles appear large in the charts with minimal to no wicks and represent a strong buying or selling pressure from the market.
Bullish Marubozu vs. bearish Marubozu
A bullish Marubozu is a candle where the open price is also the lowest price, and the close price is also the highest price.
This candle indicates a strong buying momentum, meaning that bulls controlled the session and that sellers weren’t able to create any resistance to the rising price.
This means the market is optimistic about the asset, and prices have a higher chance of going up even more.
If a bullish Marubozu appears during an uptrend, it’s a strong signal that the trend will keep going. If it appears during a downtrend, it might be a sign that a reversal is starting.
A bearish Marubozu is pretty much the opposite. The open price is the highest price and the close price is the lowest price. For clarity, check out the table below for a side-by-side comparison:
Bullish Marubozu | Bearish Marubozu |
Green or white | Red or black |
Open price is the lowest price | Open price is the highest price |
Close price is the highest price | Close price is the lowest price |
Buyers dominated the session | Sellers dominated the session |
Market is optimistic | Market is pessimistic |
During an uptrend signals continuation | During an uptrend signals a reversal |
During a downtrend signals a reversal | During a downtrend signals continuation |
It’s important to note that both patterns will have more reliability if they appear together in high-volume trading sessions. With more people bullying or selling, it’s a clear signal that they are strong representations of market sentiment.
Also, like many other patterns in a financial chart, they require a holistic approach with other indicators and key market information. They shouldn’t be used in isolation. Instead, they are better used alongside different tools within a trader’s toolkit.
How to use Marubozu candles in your trading
Here are some tips for integrating Marubozu candlestick patterns into your short and long-term strategies:
Observe the context. Depending on its position and type of candle, a Marubozu candle can have different meanings. For example, if a bullish Marubozu appears during a downtrend, this can signal a reversal. If it is a bearish Marubozu, it probably means the downtrend will continue. Pay attention to these nuances and always try to see the bigger picture.
Use other indicators. Support and resistance levels near Marubozu candles can be a sign of a breakout. It’s also important to check other indicators together with a Marubozu, like moving averages, volume of transactions, RSI (relative strength index), and even major economic and political news.
Check the time frame. Bigger timeframes, like daily or weekly charts, can bring more meaning to the Marubozu candle’s appearance, as they represent a longer market sentiment over time. They carry less weight because of market noise and intraday volatility within smaller timeframes, like 15-minute, or even hourly.
Wait for the period to be over. A candle that appears like a Marubozu in the middle of the trading session can look completely different at the end. Wait for the period to be over to make any decisive conclusions.
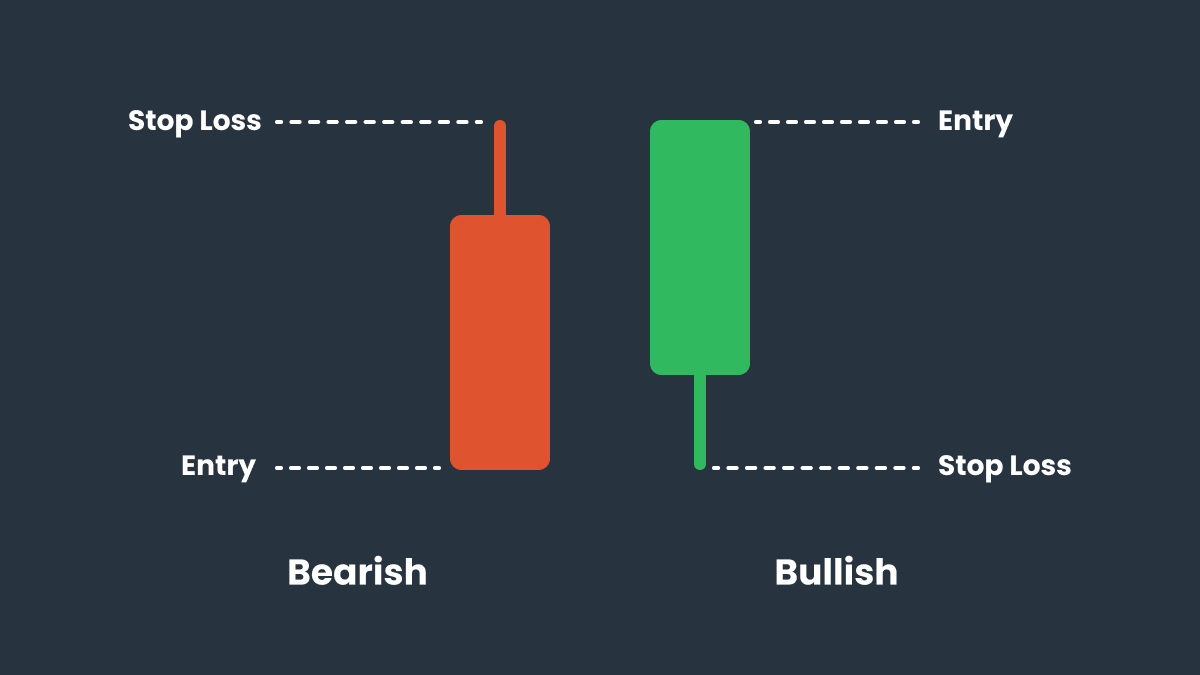
Set stop-losses and take-profits. A bullish Marubozu can be seen as an invitation to open long positions and a bearish Marubozu can be seen as an invitation to open short positions, however, it’s very important to try to confirm the trends and use proper risk management with stop-losses and take-profits. For a bullish Marubozu, you can set a stop-loss below the candlestick’s low. For a bearish Marubozu, you can set a stop-loss above the candlestick’s high.
Pros and cons of Marubozu candlesticks
Here are some pros and cons that you should pay close attention to while trading with Marubozu candlesticks.
Pros
Marubozu candles are very versatile and can be used in many different markets, like stocks, forex, cryptocurrencies, and so on.
They are very easy to see and understand, making them a useful tool for beginners to start planning their trading moves using indicators.
They are strong signals of market sentiment and momentum, reflecting a higher chance of reversals, trending continuations, or breakouts.
Cons
Marubozu candles need confirmation and are more reliable if they are analyzed together with other indicators, like trading volume and moving averages.
They are also less reliable in volatile markets and when they appear in shorter time frames, causing confusion in traders.
Because of their meaning, they can make people overreact in their trading moves, causing bigger losses if the market behaves in a different way suddenly.
In summary, despite Marubozu candles being a strong indicator, it’s important to also take precautions and use proper risk management while trading with them.
The importance of Marubozu candlesticks
Marubozu candles are crucial for predicting market behavior and changes. They need to be a part of every trader’s toolkit.
While it’s always important to use indicators together, these candles can be an easy way to quickly see if the market is getting ready for a reversal or other important changes.
Start looking for them in your charts and use these patterns to make well-informed decisions in your trading strategies.
Summary
Marubozu candles are large-bodied candlesticks with no to minimal wicks or shadows. Their bodies represent the opening and closing prices of a specific asset in a specific trading period.
Because of this lack of price retracement, Marubozu candles are a clear sign of a strong market sentiment, whether bullish or bearish. Traders can use the appearance of those candles to make trading decisions and amplify their chances of profits.
While these Marubozu patterns are crucial, it’s also important that traders never trust them in isolation, confirming their predictions with other indicators and key market information.
Ready to start? Open your account on FBS today and start trading with a reliable and easy-to-use platform.