What is the Quasimodo pattern in Forex?
The Quasimodo pattern (QM) is a useful tool in Forex trading, as it helps traders find early entry points into emerging trends after a market reversal.
Oct 30, 2025
Strategy
The Quasimodo pattern (QM) is a useful tool in Forex trading, as it helps traders find early entry points into emerging trends after a market reversal.
A QM is a reversal pattern that signals the formation of a new trend after reaching a minimum or maximum. The structure of the Quasimodo allows you to set your stop-loss accurately and makes it possible to record trend movements exactly.
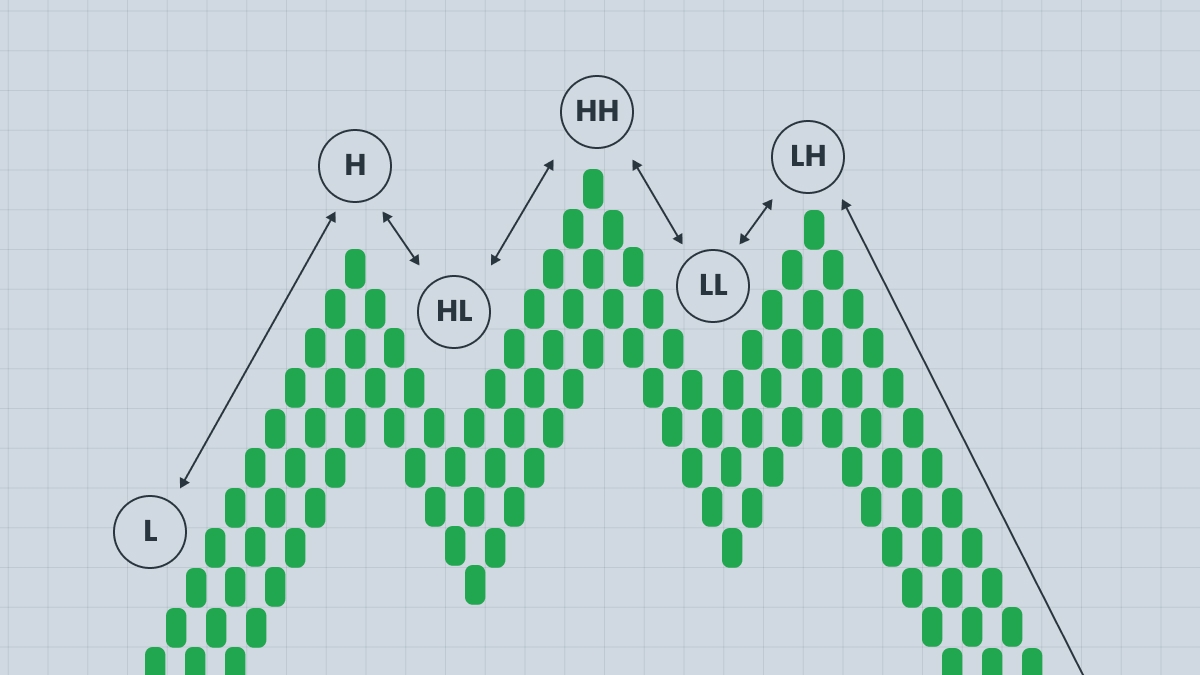
How do you identify the Quasimodo pattern on a chart? This pattern consists of three distinct peaks or equally distinct troughs, depending on whether the chart depicts a bearish or bullish scenario. The pattern is named after the character in Victor Hugo's novel because of the asymmetric nature of price movement.
There are five conditions for the formation of the Quasimodo pattern.
1. Formation of a lower low or higher high with a strong bearish or bullish trend.
2. A false breakout of the previous structure is formed. At first, it seems that it has been broken through, but then a pullback happens.
3. A sharp reversal confirms that the breakout has failed.
4. The test of the original zone occurs again, most often in those places where the breakout failed.
5. An entry trigger is formed when re-entering the base zone.
There are two types of Quasimodo pattern: bearish and bullish. In a bearish pattern, the highest peak will be the middle peak, with peaks slightly lower on either side. This pattern signals a potential downtrend.
A reversal from a downtrend to an uptrend can be possible with a bullish Quasimodo pattern. In this pattern, the middle trough is at the minimum, and the extreme peaks will be slightly higher.
What exactly is the pattern?
The Quasimodo pattern may look complicated at first, but its idea is simple:
The market pushes in one direction, fakes a breakout, then snaps back the other way. The entry point is usually where price comes back to test the old level — known as the Quasimodo level (QML).
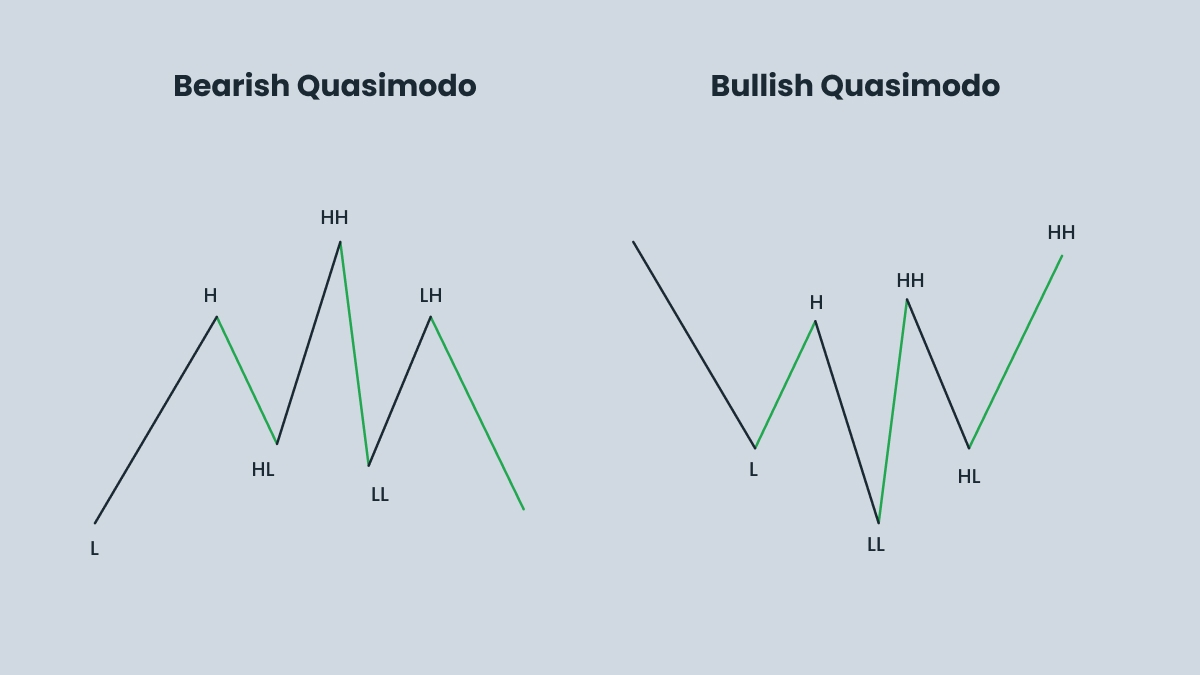
Bearish Quasimodo:
The price makes a new higher high (buyers think the uptrend will continue).
Then the market suddenly drops and makes a lower low, breaking the uptrend.
Finally, the price goes back up to the old high (the left shoulder / QML) and stalls. That’s the entry for a sell.
If the price climbs above the head (the highest high), the setup is invalid.
Bullish Quasimodo:
The price makes a new lower low (sellers think the downtrend will continue).
Then the market jumps and makes a higher high, breaking the downtrend.
After that, the price pulls back to the old low (the left shoulder / QML). That’s the entry for a buy.
If the price drops below the head (the lowest low), the setup is invalid.
.jpg)
Quick identification checklist:
Look for a clear uptrend or downtrend.
Spot the “trap” move — a new extreme high or low that quickly fails.
Wait for the price to break the structure in the opposite direction.
Enter when the price retests the Quasimodo level.
Always protect the trade with a stop-loss beyond the head.
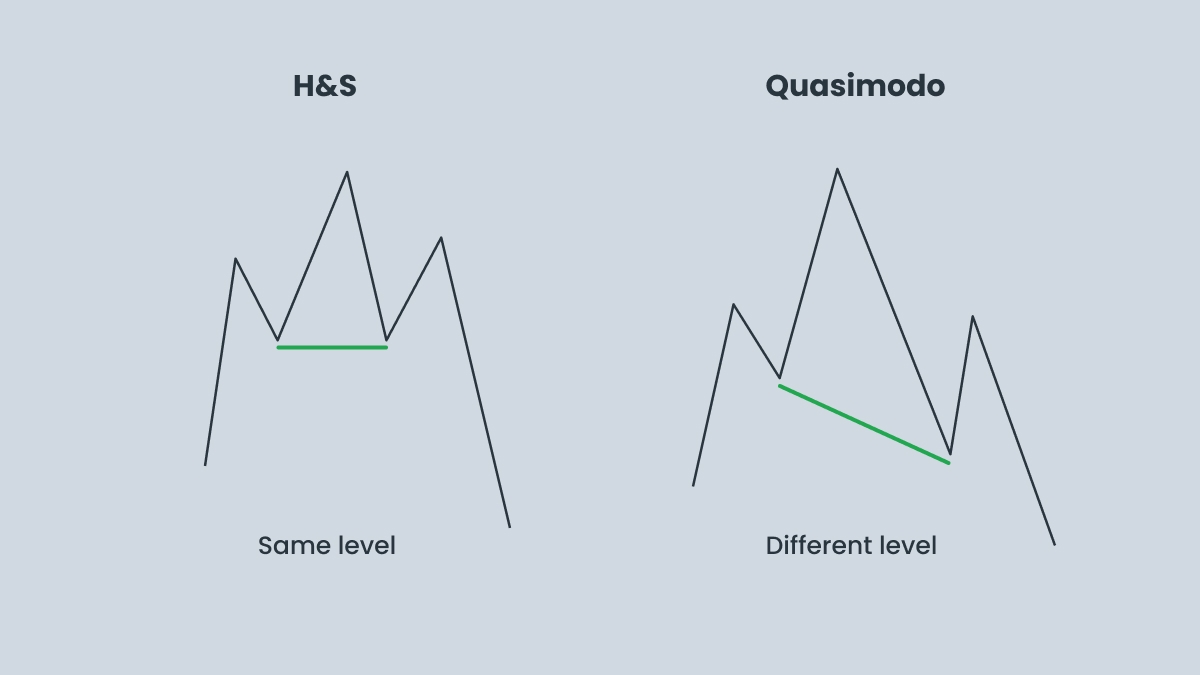
There is another pattern that can be confused with the Quasimodo pattern — the Head and Shoulders. Both patterns are reversal structures with three peaks or troughs and a central head, but they provide different entry and exit points and differ in mechanics.
The Head and Shoulders pattern has three highs and two lows in a bearish scenario, with the second peak being the highest. Three lows and two highs appear in a bullish scenario, with the second low being the lowest. To distinguish this pattern from a QM, look at the structure. A H&S is confirmed when the price breaks below the neckline, signaling a likely reversal. For a QM, the price first breaks the previous structure before retesting the left shoulder.
The Quasimodo pattern is based on the concept of higher highs and lower lows. The reversal occurs sharply and changes the structure of the previous trend. If you draw a neckline, it will be tilted. The third minimum (in a bullish QM) or the third maximum (in a bearish QM) exceeds the previous levels and then reverses.
This article explains a strategy called HHLL. You may have seen similar strategies under different names, since it’s based on classic Forex principles. The best part is that you don’t need any indicators to use it.
The classic entry into a trade with the Head and Shoulders pattern occurs when the right shoulder line crosses the ‘neck’. In this case, traders have a chance to get a guaranteed profit, since it is believed that the price level will fall no less than the height of the head.
The Quasimodo pattern allows for an early entry. It is usually made before the neck line during a retest of the last structural level (point A). This gives a better R:R ratio, but requires accuracy. It is assumed that the price can bounce off the second peak, forming a pattern, and continue moving in the direction of the expected reversal.
| Pattern type | Structure | Trade bias |
| Bearish quasimodo pattern | HH – LL – Retest | Sell setup |
| Bullish quasimodo pattern | LL – HH – Retest | Buy setup |
In both bullish and bearish cases, there is a breakout of the internal structure, followed by a return to the base.
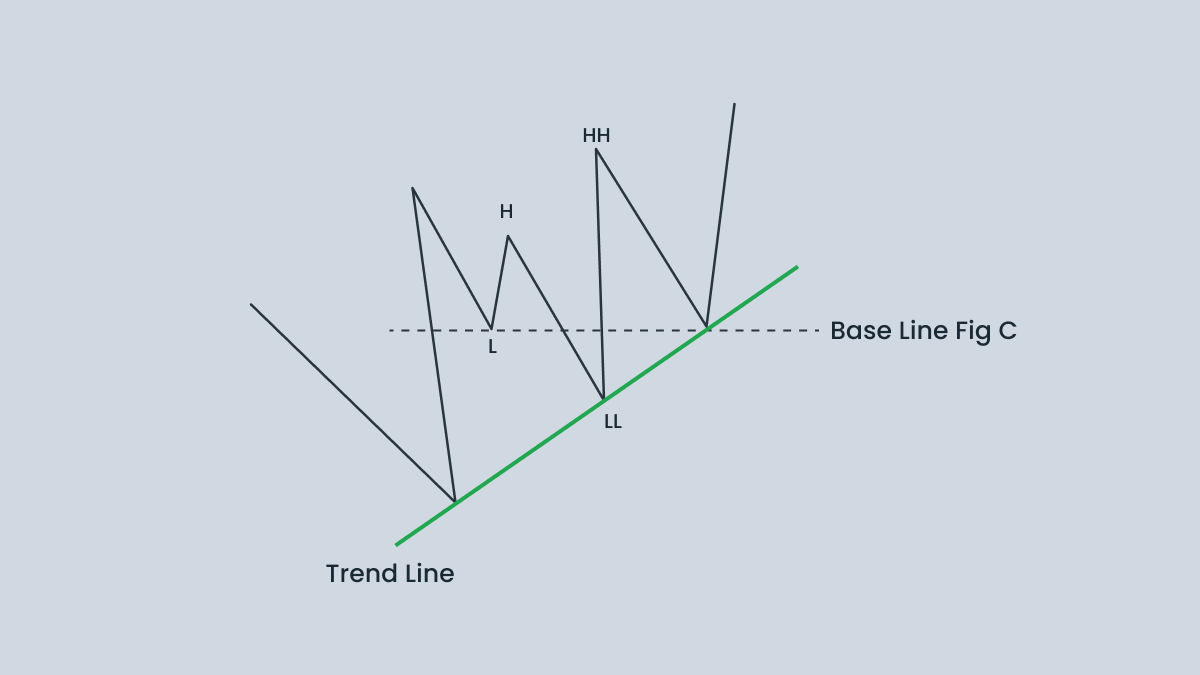
1. The bullish Quasimodo pattern appears at the end of a downtrend and signals a potential upside. The market forms lower lows (LL) and lower highs (LH). The new low convinces traders that the downtrend will continue, but the price suddenly breaks the structure and forms a new higher high. The price then returns near the level of the previous low. In this scenario a bullish reversal occurs.
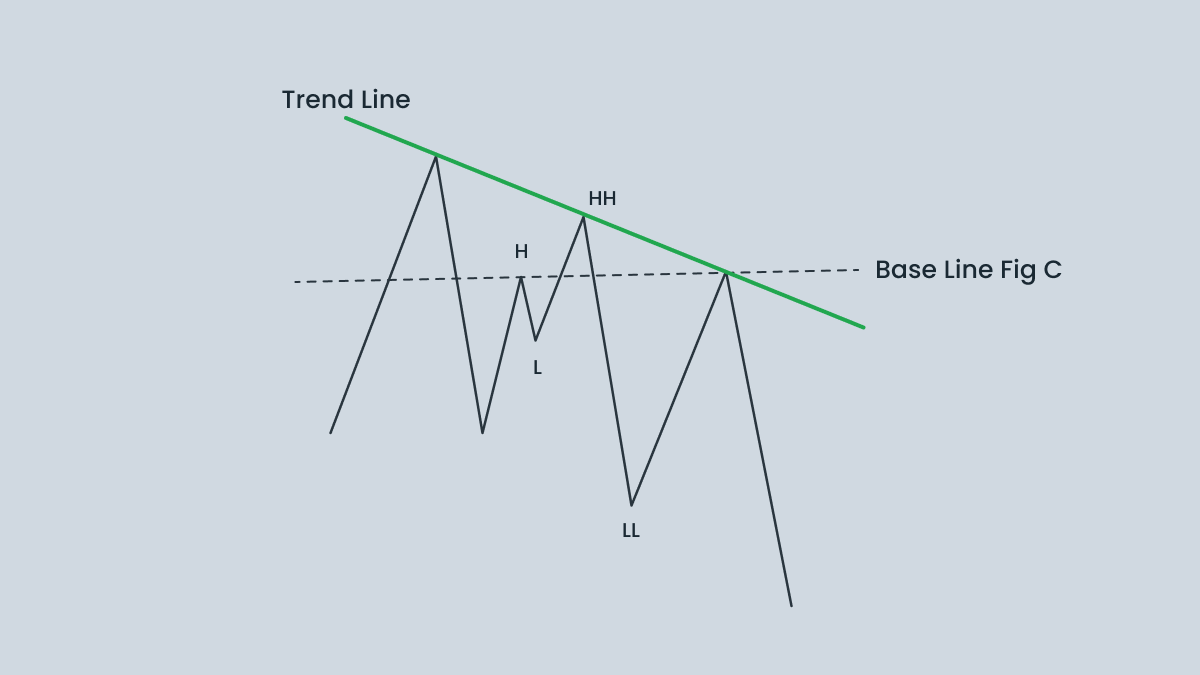
2. The bearish Quasimodo pattern is the opposite of the bullish one. It appears at the end of an uptrend and foretells a market decline. Higher highs and higher lows are formed. Traders who trade the breakouts are trapped by the new highs. The price breaks through the structure, creating a new lower low, then retraces back to the previous high.
Both patterns need confirmation — do not rush into a trade when the price pulls back.
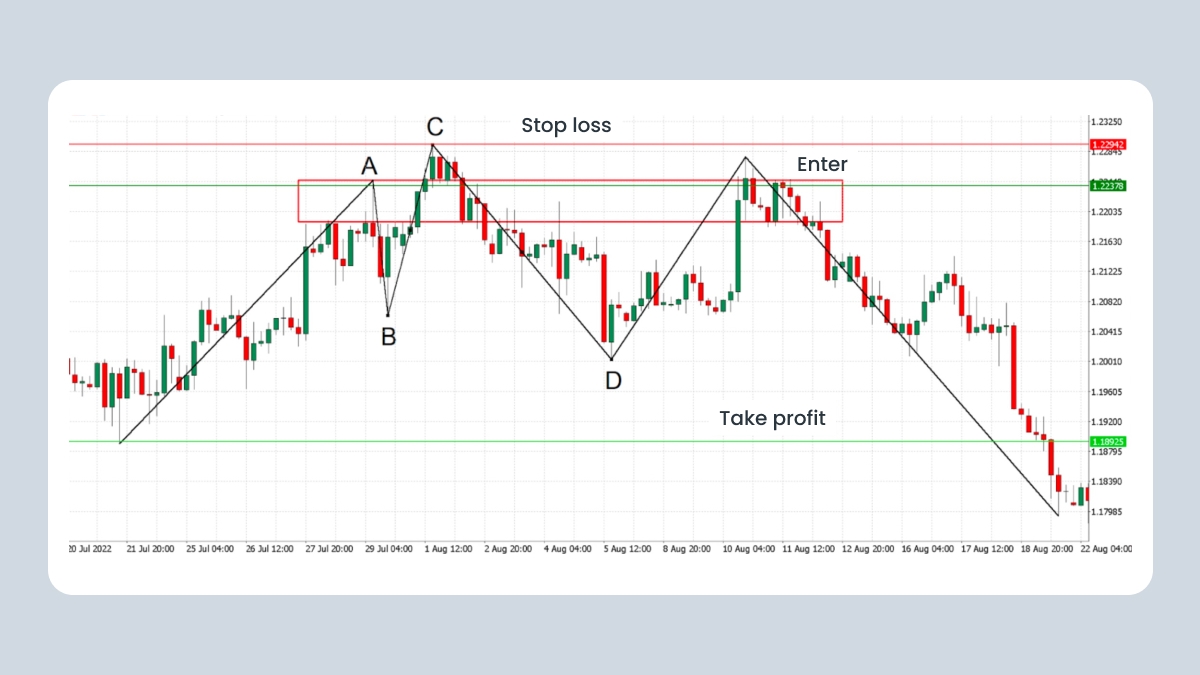
Let’s see how the Quasimodo pattern works in practice in an uptrend.
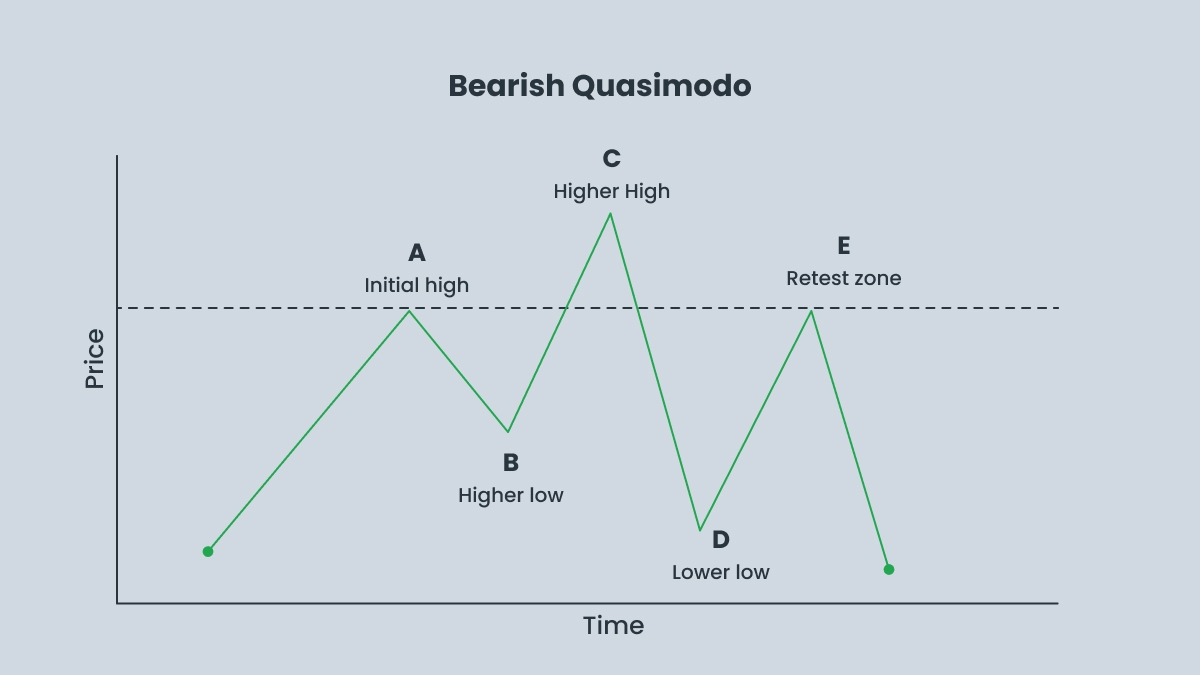
1.Point A is the first indicator of potential reversal and future resistance. For the bearish model of Quasimodo, it’s the initial high of an uptrend.
2.Point B is a corrective pullback, because the price rolls back and the temporary minimum creates a neck line.
3.Point C demonstrates that the price is moving up, creating a new extreme point compared to Point A. This is the highest maximum for a bearish pattern, which indicates new potential resistance in the future.
4.Point D shows the price making an impulse move in the opposite direction and forming a lower low, breaking the neckline set at point B. This step is an important confirmation of the developing trend.
5.Point E demonstrates that the price comes back to Point A, which acts as resistance, not rising above Point C. This is an ideal point for entry.
Here is an example of how the Quasimodo works in a downtrend.
1.Point A is the starting point of a downtrend, which forms the penultimate minimum and indicates a potential change in trend.
2.Point B is a corrective pullback, during which a temporary maximum is formed and horizontal resistance is established.
3.Point C shows that the price is falling again and a lower minimum is formed. It is in this area that future support is formed and the downward movement ends.
4.Point D is the formation of a higher maximum. This point is called the Quasimodo level and it confirms a bullish reversal.
5.Point E shows that the price is rolling back to the level at point A. This point is optimal for entry.
Not every Quasimodo signals the end of a trend. Sometimes the market forms the same pattern within a trend, pushing in the same direction. This is known as a Quasimodo Continuation.
In a bullish continuation, the market is already trending up. The price falls to a temporary lower low (a shakeout), breaks above the previous high (BOS), then pulls back and retests the Quasimodo level (the left shoulder) before continuing higher.
The continuation traps traders who bet on an early reversal. The false break (the “head”) creates a burst of activity, while the BOS re-confirms the dominant trend. Smart money uses this retest to reload positions following the trend’s direction.
Identify a clear dominant trend(look at H4/D1 for clarity).
Spot the false break against that trend (the “head”).
Wait for the BOS that re-aligns with the dominant trend.
Enter when the price retests the left shoulder (QML) with confirmation.
Place stops beyond the head, and targets in line with the prevailing trend.
Traders use different tools to identify the Quasimodo pattern.
First of all, you should pay attention to trendline and fractals, because the Quasimodo pattern forms only in an uptrend or a downtrend. It will help you mark swing highs/lows.
If the RSI (Relative Strength Index) demonstrates regular divergence, it often means that the market is ready for reversal. If it shows hidden divergence, that can signal the continuation of the current trend.
A rectangle is often formed when the price is moving sideways, between a clear support (bottom) and resistance (top). This means the price is stuck in a range. In a Quasimodo pattern, this sideways movement can be part of the pattern where the price makes a failed swing (a higher high or lower low that does not hold) before reversing direction.
Use the RSI and MACD to spot when price and momentum don’t agree. If the price makes a new high or low but the indicator doesn’t follow, this shows that momentum is fading and a reversal might be near.
Watch how the moving averages behave. When a short-term average like the 20 crosses a longer one such as the 50, it often means the market is shifting direction or confirming a new trend.
Pay attention to volume, too. A rise in volume during the break of structure or when the price retests the Quasimodo level usually means strong players are involved, which gives the signal more weight.
You can also check Fibonacci retracement levels. When the Quasimodo level aligns with a key ratio like 61.8% or 78.6%, that zone becomes stronger and the chance of a successful reversal increases.
1. Make sure there is a clear trend before the Quasimodo structure is formed.
2. Zoom out and note if there are any breaks in the structure. Ignore minor pullbacks.
3. Note the minimum or maximum followed by a pullback.
4. Wait for the price to reach the original zone.
5. Look for confirmation, such as RSI divergence.
Remember that there is no universal indicator for the Quasimodo pattern. Use additional tools for analysis, and don’t flag on logic and patience. A good combination of the Quasimodo is with trend lines and imbalances.
Checklist for spotting and trading Quasimodos
Identify: Clear trend, false breakout, and break of structure.
Confirm: Rejection or divergence near the Quasimodo level.
Enter: On retest of QML with a confirmation candle.
Stop-Loss: Stop beyond the head.
Take Profit: Aim for at least 1:2 R:R.
Management: Move stop to breakeven at 1R and then trail.
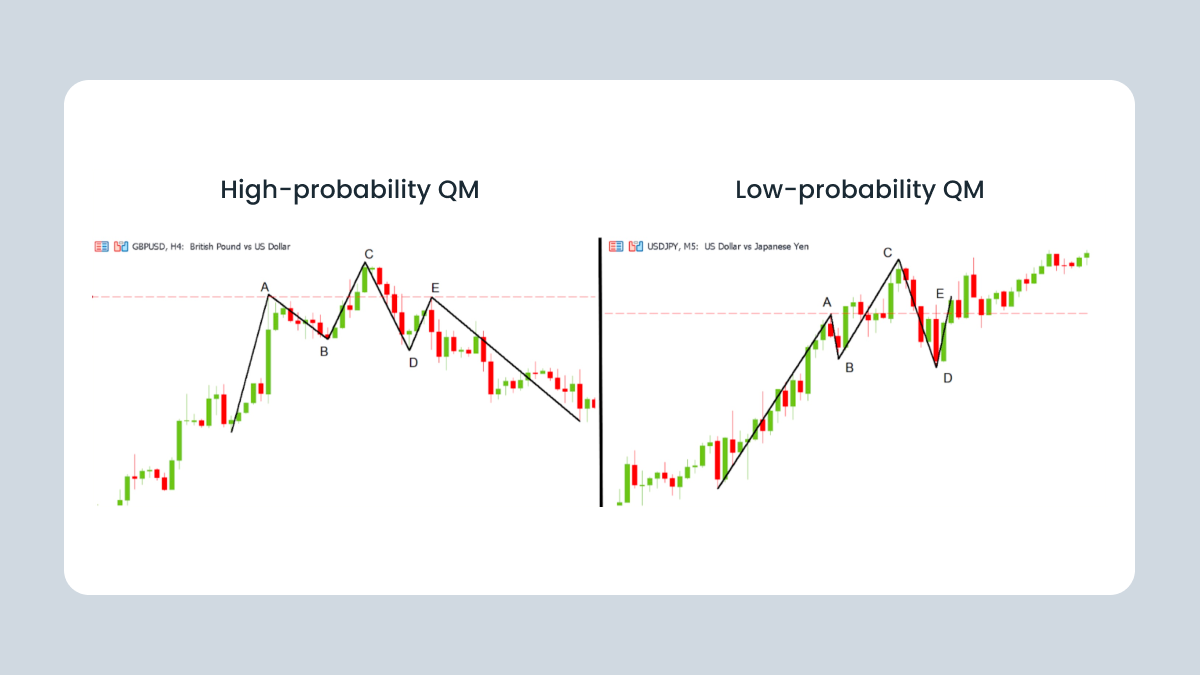
Not every Quasimodo has the same weight. The pattern’s reliability depends on where it forms and on what timeframe you trade.
H4 and Daily: These are the best ones to watch. The pattern takes time to form, and higher timeframes filter out noise. Most professional traders look for Quasimodos here to avoid false setups.
Lower timeframes (M15–H1): These can still work, but they require extra caution. They’re more prone to fakeouts and should always be traded with confirmation.
Supply and demand zones: A bullish QM forming at a demand zone or a bearish QM forming at a supply zone is far more reliable. These zones give you extra confirmation and indicate that big players are active.
Trend strength: The best setups happen after a strong trend extension. Weak or sideways markets produce sloppy, unreliable patterns.
Volatility conditions: QMs are cleaner when volatility is high enough to break structure, but not enough that the price jumps all over the place. Major news events can render the setup unreliable.
Before trading any QM, ask yourself:
What timeframe am I on? If you’re below the H1 chart, you need extra confirmation.
Is the pattern forming inside a supply or demand zone? If not, skip the trade.
Was the trend strong before the break of structure? If not, the pattern is weak and less reliable.
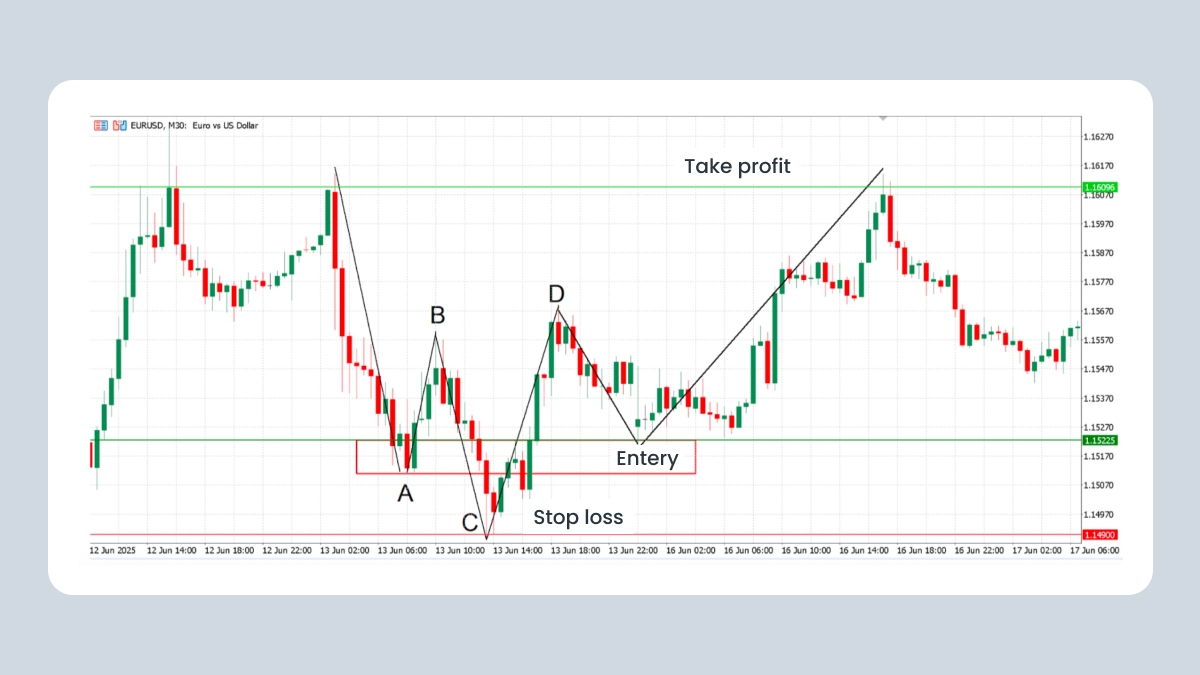
Entry strategy varies depending on the type of QM. Let’s have a look at a strategy for a bullish QM.
1. Identify the Quasimodo pattern in the key swing points A, B, C, and D.
2. Enter long at point A when price retests the demand zone and retraces down from point D.
3. Set a stop-loss slightly below the low of point C to manage risk.
4. Set a take-profit order at the peak between the head and the right shoulder, apply a risk to reward ratio of at least 1:2.
Take these steps for a bearish QM.
1. Mark swing points A, B, C, and D to define the Quasimodo reversal structure. This step is the same as for a bullish QM.
2. Enter short near Point A as price retests its supply zone and pulls back after Point D.
3. Place the stop-loss just above the high of point C to manage downside risk.
4. The take-profit should be at prior resistance zones or align with a risk/reward ratio of 1:2 or better.
Managing the trade well matters just as much as spotting the pattern. Once you’ve entered, it's time to protect your capital and give the setup room to work.
ATR-based stop buffer
Instead of placing your stop right under (or above) the head, add a small cushion. Use about half to one times the ATR. This buffer helps keep normal price noise from stopping you out early.
Risk per trade
Keep your risk small. Aim to risk no more than 1–2% of your account balance on a single trade.
Scaling out
When the price moves about twice your risk (2R) in your favor, you can take partial profit. For example, close half your position and move your stop to breakeven. You’ll lock in gains but still give the rest of the trade space to grow.
Trailing the stop
As the trend continues, adjust your stop. In a bullish QM, trail it below each new higher low. In a bearish QM, trail it above each new lower high. This helps you secure profits without cutting the trade too early.
Rechecking the setup
Keep an eye on market conditions. If volatility spikes or structure shifts, recheck your stop and targets (1:2, 1:3, or even larger in favorable setups). The QM is rarely a textbook formation. Small tweaks keep your trade aligned with what’s happening.
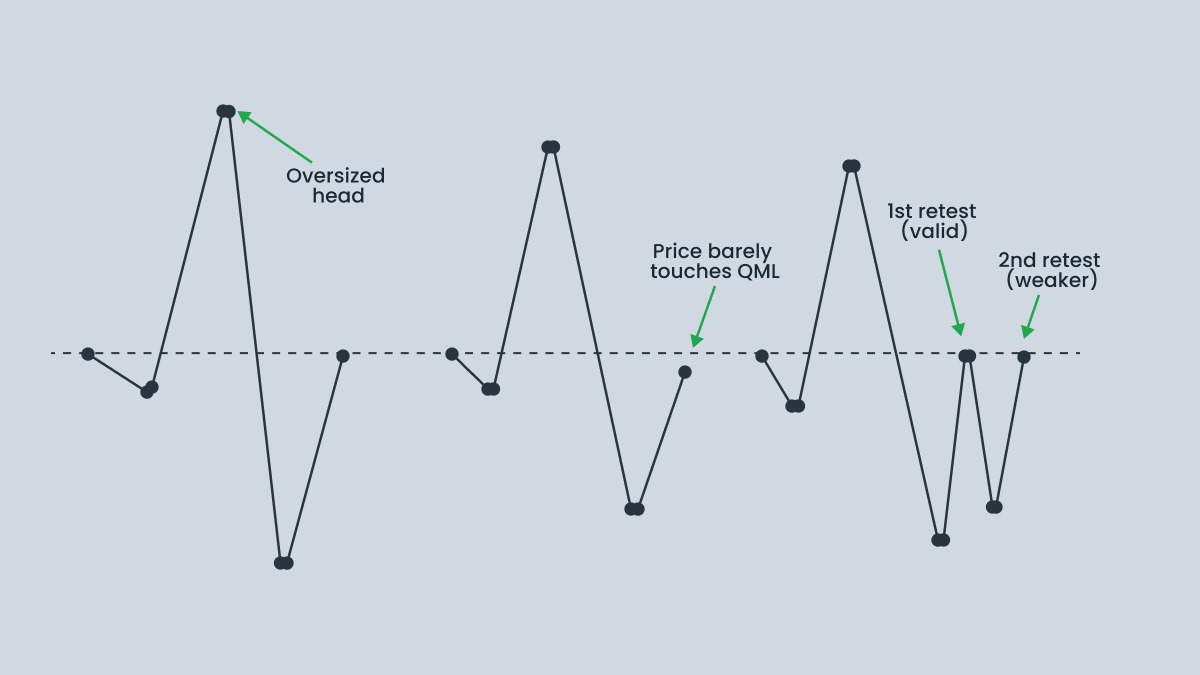
Markets rarely draw textbook Quasimodos. The left shoulder isn’t always clean, the head may stretch too far, and the retest can be shallow. Knowing how to adapt helps you stay in the game.
Oversized head: Sometimes, point C stretches much further than expected.What to do: Use a wider stop, but reduce your position size. If your R/R drops below 1:2, skip the trade.
Shallow retest: The price might only touch the Quasimodo level (A) before moving away.What to do: Consider placing a limit order slightly in front of the level, or wait for a clear rejection candle.
Double retest: Instead of one clean pullback at point A, the price may return twice or more.What to do: Only trade the first retest with full size; later ones are less reliable.
Broken symmetry: A–E swings may be uneven or choppy.What to do: Zoom out. If the big picture still shows extension → BOS → retest, the setup can still be valid.
Your entry rules already define where to place a stop-loss (just beyond point C) and how to aim for a 1:2 risk/reward ratio. But real trading rarely amounts to textbook examples. Here are some practical ways to manage positions better:
Add a cushion. Don’t set the stop right at C — give it a few extra pips of breathing room to cover the spread and intraday noise.
Scale out. Take partial profit at 2R and let the rest ride toward a bigger target.
Trail your stop. In a bullish QM, move your stop under each higher low; in a bearish QM, above each lower high. This locks gains without cutting the trade too early.
Watch correlation. Don’t take several QMs on pairs that move the same way — if one gets stopped out, the others are likely to as well.
Before applying the Quasimodo setup in live trading, it’s important to weigh its advantages and limitations.
Pros
Lets you enter early.
Has a clear structure.
Offers strong risk/reward.
Works across markets.
Flexible for different styles of trading.
Cons
Not easy to spot. It takes time to train your eye.
False signals are common.
Needs confirmation.
Demands patience.
Highly dependent on context.
The Quasimodo is powerful, but far from foolproof. Most failed trades come from ignoring its limits.
Look-alikes
Many zig-zags look like a Quasimodo until you zoom out. If the structure doesn’t have a clear higher high or lower low followed by a break of structure, it isn’t valid.
Late identification
By the time some traders realize the setup is forming, the ideal entry point has already passed. A late entry often means chasing.
Retest trap
Not every pullback to the Quasimodo level offers a clean entry. The price can cut straight through the level and stop you out.
Market conditions
The pattern works best when the market has momentum. In choppy, sideways action, Quasimodo levels lose their reliability.
Discipline and pressure
The hardest part is waiting. Many traders pull the trigger early or skip confirmation because they get impatient, turning a structured setup into a gamble.
The Quasimodo pattern is only as good as the context around it. Use it in trending markets, check for confirmation, and manage risk with stops and targets — otherwise it can quickly do more harm than good.
Even experienced traders can use the Quasimodo pattern the wrong way. Below are the most frequent pitfalls — and how to avoid them:
Ignoring confirmation signalsMistake: Entering as soon as price touches the QML, without waiting for rejection.Solution: Check for at least one confirmation — e.g. a rejection wick, RSI/MACD divergence, or a lower-timeframe break of structure.
Seeing QMs everywhereMistake: Labeling any higher high or lower low as a Quasimodo.Solution: A valid QM needs both a trend extension (point C) and a decisive BOS (point D) before retesting point A. No BOS, no trade.
Entering before the pattern is completeMistake: Entering at point D, before the price returns to the QML.Solution: Discipline. Wait for the price to retest point A (the left shoulder level).
Ignoring market contextMistake: Trading a QM against the higher-timeframe trend or outside supply and demand zones.Solution: Filter setups by market structure and zones. Focus on H4/D1 charts for more reliability.
Poor position sizingMistake: Risking too much on a single pattern because it “looks perfect.”Solution: Keep risk per trade at around 1–2% of your account size and always measure R/R before entry.