Oscillator Indicators
What is an oscillator?
An oscillator is a technical analysis tool, an indicator that helps traders forecast market trends and, therefore, prices. Special bots help with oscillator trading: noticing market movement through the indicator, they provide a signal to buy or sell an asset.
How do oscillators work?
These trading indicators are commonly used with other technical analysis tools to make trading decisions. Based on analysts’ experience, oscillators perform well when it is hard to identify an apparent trend, for instance, when a stock trades horizontally.
The best oscillator trading strategy to use will depend on the circumstances. Though the most widespread oscillators are:
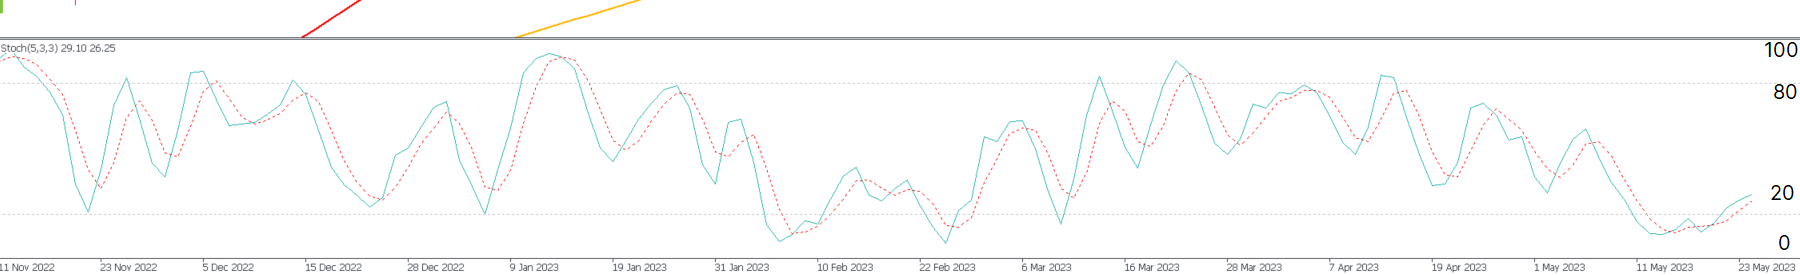
- The stochastic oscillator
- Relative strength indicator (RSI)
- Awesome oscillator
- Money flow index (MFI)
- Rate of change (ROC)
If you decide to use an oscillator, two values should be chosen. Then, an oscillator is placed between them to create a trend indicator. This indicator illustrates up-to-date market conditions for a specific asset you have selected. When an oscillator shifts closer to the higher value, the asset is regarded as overbought. Otherwise, the asset is considered oversold.
Mechanics of an oscillator
In technical analysis, oscillators are measured on a percentage scale from 0 to 100. The oscillator indicator is located on a separate interactive chart.
The oscillator has one constant line: the zero line. Two lines, the overbought and oversold lines, also have to be selected separately. To find these lines, a trader needs to analyze the history and the range in which the indicator’s measures move.
Despite their relative simplicity, oscillator indicators can give a trader several signals besides buy or sell. The most common among them are:
- The entry of the oscillator line into the overbought and oversold zones
- The oscillator line crosses the zero level
- Deviation of the oscillator line from the price chart
- Mutual intersection of fast and slow oscillator lines
Signals are only accurate when the underlying security price is within the specified range. Although, they appear to be misleading when a price breakout happens. This may result in going beyond the range that the current sideways market is in or at the beginning of a new trend.
Types of oscillators
To understand what oscillators suit best for a particular situation, you need to know their strengths and weaknesses.
There are two types of oscillator indicators:
- Leading oscillator indicators. They work proactively, giving signals before a new trend occurs. Your profit comes from the opportunity to predict price shifts. Unfortunately, leading indicators are notorious for providing false signals from time to time.
- Lagging oscillator indicators. On the contrary, they give signals after a new trend has started. They don’t alert you in advance but indicate what happens with the prices de facto. Alas, It is not rare for the biggest profits to be gained in the first few bars of a trend, so lagging indicators will not give you this opportunity.
Overall, leading indicators perform best in sideways markets, while lagging indicators should be used in trending markets. They give signals after the price change clearly forms a trend. Using lagging indicators results in late buying and selling, but they significantly reduce risks.
Benefits of oscillator trading
The benefits of a technical tool include:
- The user can select the most convenient indication for each type of market from a large selection of indicators.
- The ability to receive leading signals about changes in the transaction allows one to respond in time and get the maximum benefit (or avoid losses).
- Flexible settings, where each user adjusts the accuracy of the signal.
- A wide range of signal types is suitable for various market situations.
- Oscillator indicators are the most understandable tool for trading on the stock exchange, as they indicate the best time to open buy or sell orders.
Example of oscillator indicator
One of the most commonly used oscillator indicators in trading is the Relative Strength Index (RSI).
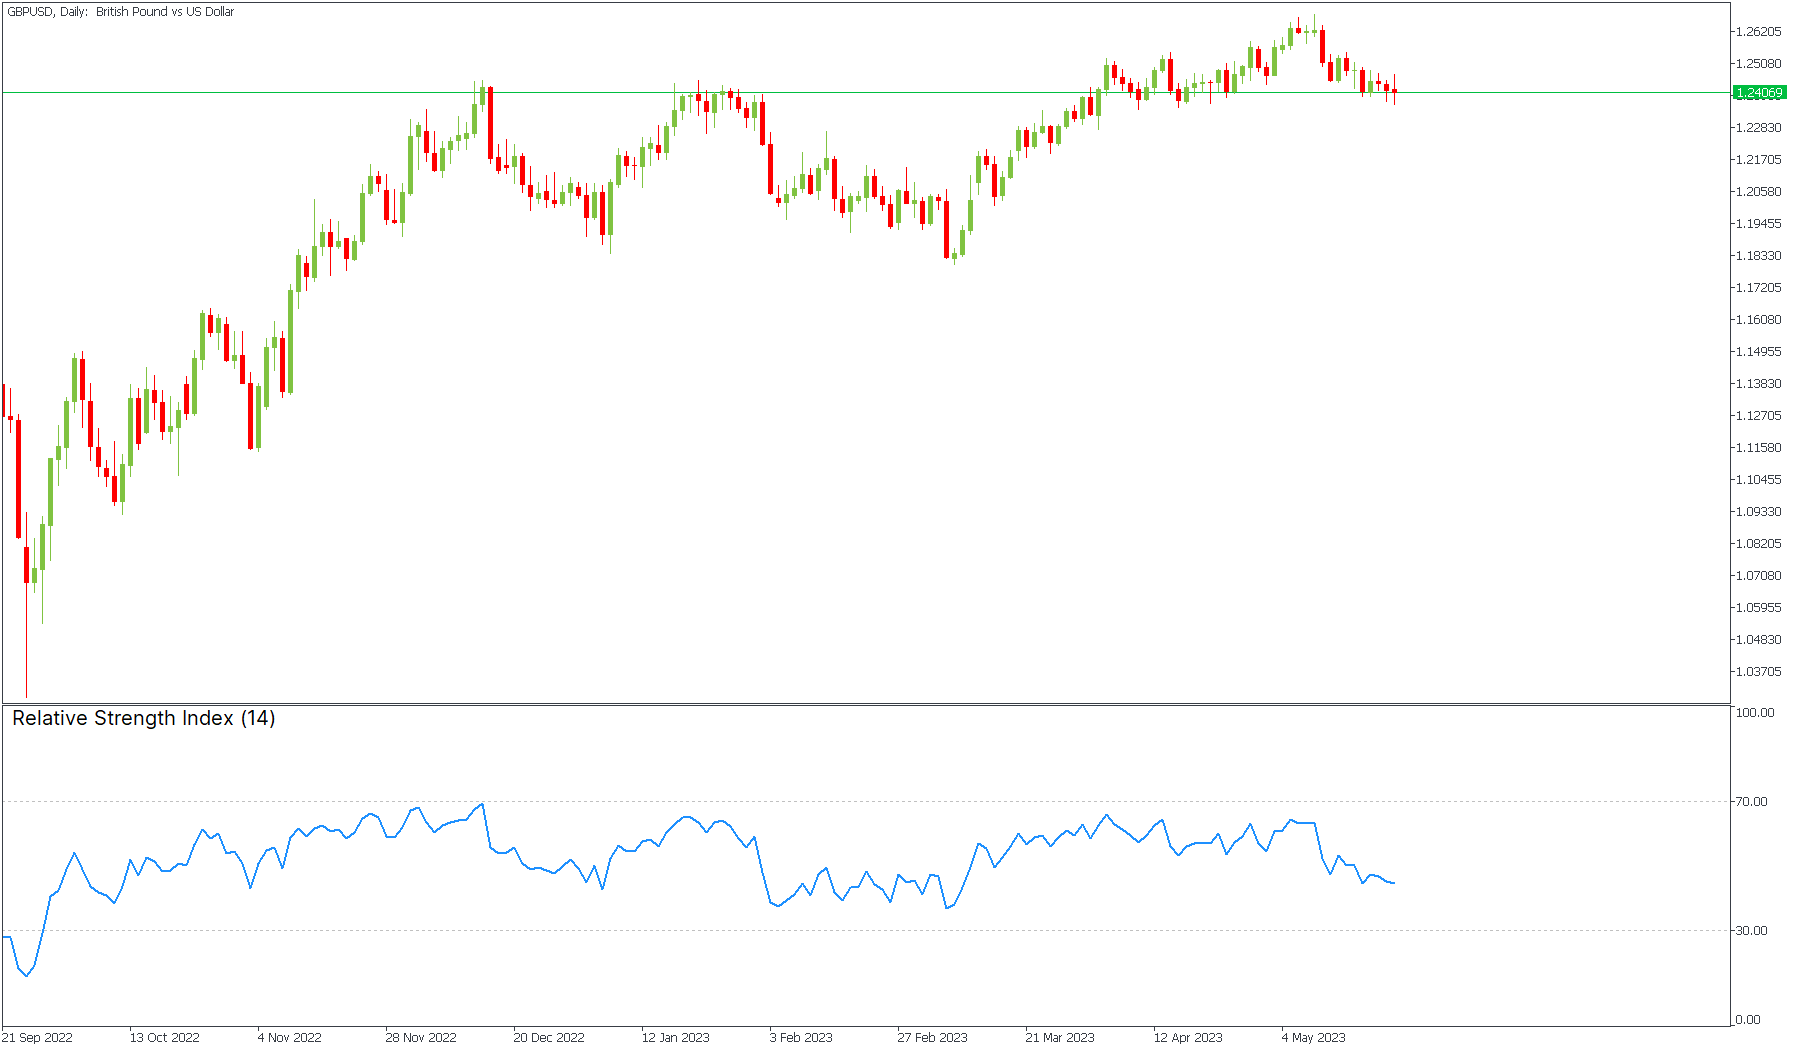
RSI contrasts the size of recent gains with the dynamics of recent falls. Similar to employing the stochastic oscillator strategy, for instance, RSI can identify an asset's oversold and overbought states. Also, it is considered to be one of the best oscillators for day trading.
The RSI indicator has a range of 0 to 100. When the indicator value reaches or approaches 70, an asset is said to be overbought. In these situations, traders frequently go short to benefit. The RSI shows a major oversold asset that is probably worth buying if it is close to the 30 level. Therefore, when the RSI is over the overbought level, it is not wise to buy an asset. When this oscillator is below the oversold level, avoid selling.
This indicator can also be used for trend-following. As long as the RSI moves upward, the asset’s price will continue to rise. As long as the RSI declines, its bearish trend restarts.
Conclusion
Oscillator indicators are very helpful for identifying the crucial entrance and exit points, especially when combined. They can be seen as the epitome of trading experience because they were typically developed by managers who were active traders. Using these indicators, you can locate a comfortable trading range and understand how experienced traders can enter and exit the market before the typical investor.