The S&P 500 was down 0.4% by midday on Thursday after shifting between small gains and losses earlier. It's been a shaky week for the index, partly due to concerns about rising tensions in the Middle East. The Dow Jones was down 273 points (0.6%), and the Nasdaq dropped 0.3%.
Oil prices jumped, with Brent crude rising 3.9% to $76.80 per barrel, as the market waits to see how Israel will respond to Iran's missile attack earlier this week. Iran is a significant oil producer, and there are concerns that a broader conflict could impact oil supply in the region.
In the bond market, Treasury yields increased after reports showed that the U.S. services sector grew faster than expected. Even though the number of layoffs remains low, hiring trends have slowed, raising questions about the job market's future. Investors are also watching for new economic updates and any further interest rate cuts by the Federal Reserve.
AMAZON – D1 Timeframe
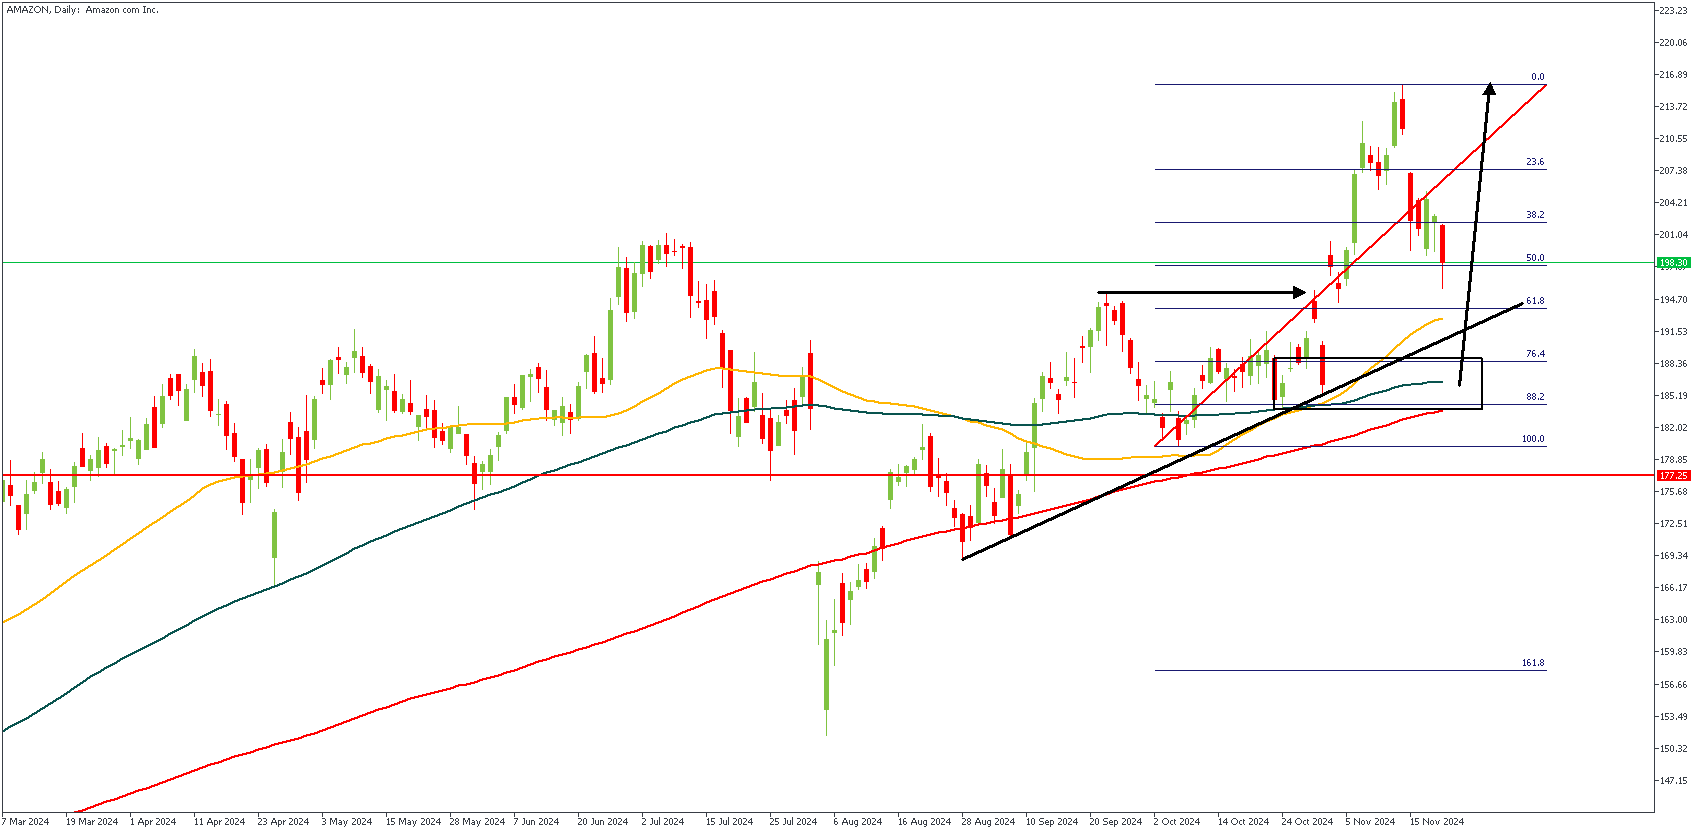
The Amazon (Daily timeframe) chart shows a bullish outlook with price action supported by a rising trendline and Fibonacci retracement levels. The chart highlights a potential upward continuation, as the large black arrow indicates, targeting resistance near recent highs around $216. A pullback to the 76% or 88% Fibonacci levels, supported by the trendline and the drop-base-rally demand zone, could offer buying opportunities. The bullish array of the 50, 100, and 200 moving averages provides further bullish confluence. The analysis suggests monitoring these technical levels for entry points while maintaining caution if the price exceeds the central support area of around $177.
Analyst's Expectations:
Direction: Bullish
Target:216.79
Invalidation:177.25
JWN – H4 Timeframe
.png)
The price is trading near the 76.4% Fibonacci retracement level, signaling a potential bullish reversal in line with the upward sentiment indicated by the black upward arrow. A strong demand zone between $22.00 and $21.50 has been highlighted, which also aligns with the 88.2% Fibonacci level, making it a critical area to watch for rejection or consolidation. The target is near the $24.81 level, corresponding to the 0% Fibonacci retracement, where the price may retest previous highs. Traders should wait for bullish confirmation near the current price or the support zone before entering long positions, placing stop-losses below the support zone and targeting take-profit levels at or near $25.
Analyst's Expectations:
Direction: Bullish
Target:25.12
Invalidation:20.90
CONCLUSION
You can access more trade ideas and prompt market updates on the Telegram channel.
