On Friday, Canada will release its labor force data for March, with expectations of adding around 30,000 jobs and maintaining a stable unemployment rate of 5.8%. However, given the inherent statistical volatility of the household survey, caution is advised when interpreting the figures, as they come with a 95% confidence interval of +/-57,000 around the estimates. Despite this, the overall trend in job creation has been robust, with Canada generating 520,000 jobs since the end of 2022, including 80,000 in the first two months of 2024 and over 180,000 in the past six months. This momentum is supported by strong economic growth, with GDP growth and employment growth showing a historical correlation. Additionally, evidence suggests that wage growth in Canada has also been positive, although further analysis is needed to confirm this.
GBPCAD - D1 Timeframe
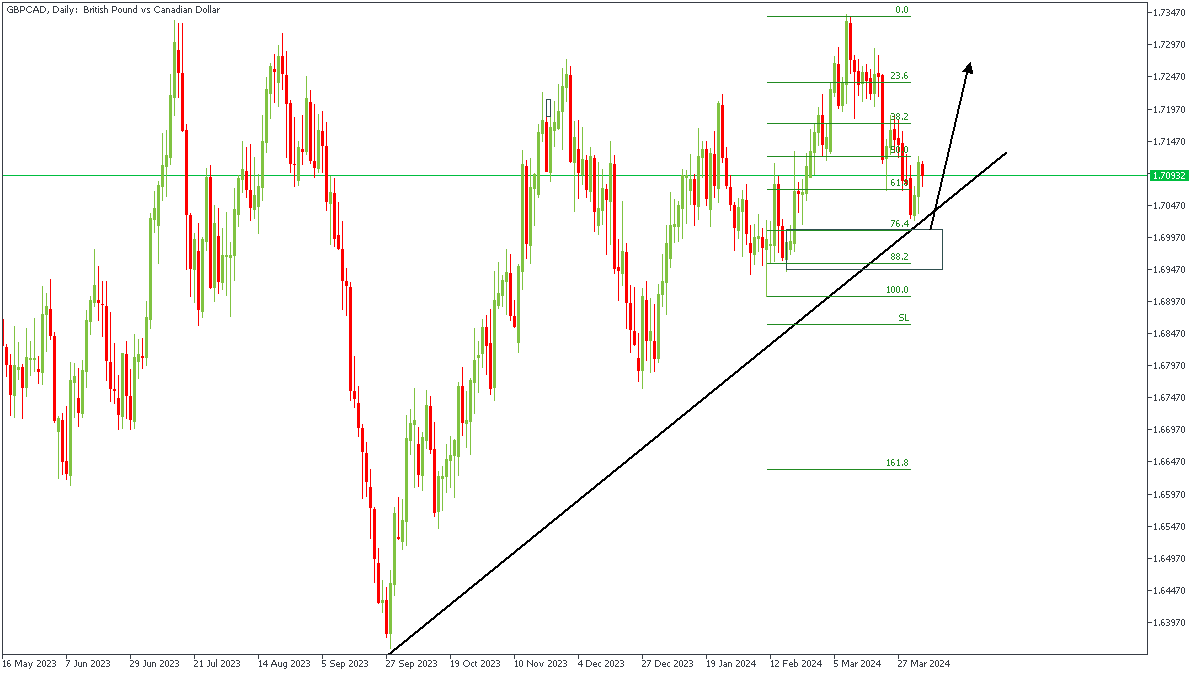
After breaking above the previous high on the daily timeframe chart, we see GBPCAD slide back down in an attempt to complete a retracement of the breakout move. My entry confluence in this case includes; the trendline support, the 76% Fibonacci retracement level, the drop-base-rally demand zone, and the overall bullish market structure.
Analyst’s Expectations:
Direction: Bullish
Target: 1.72136
Invalidation: 1.69396
NZDCAD - D1 Timeframe
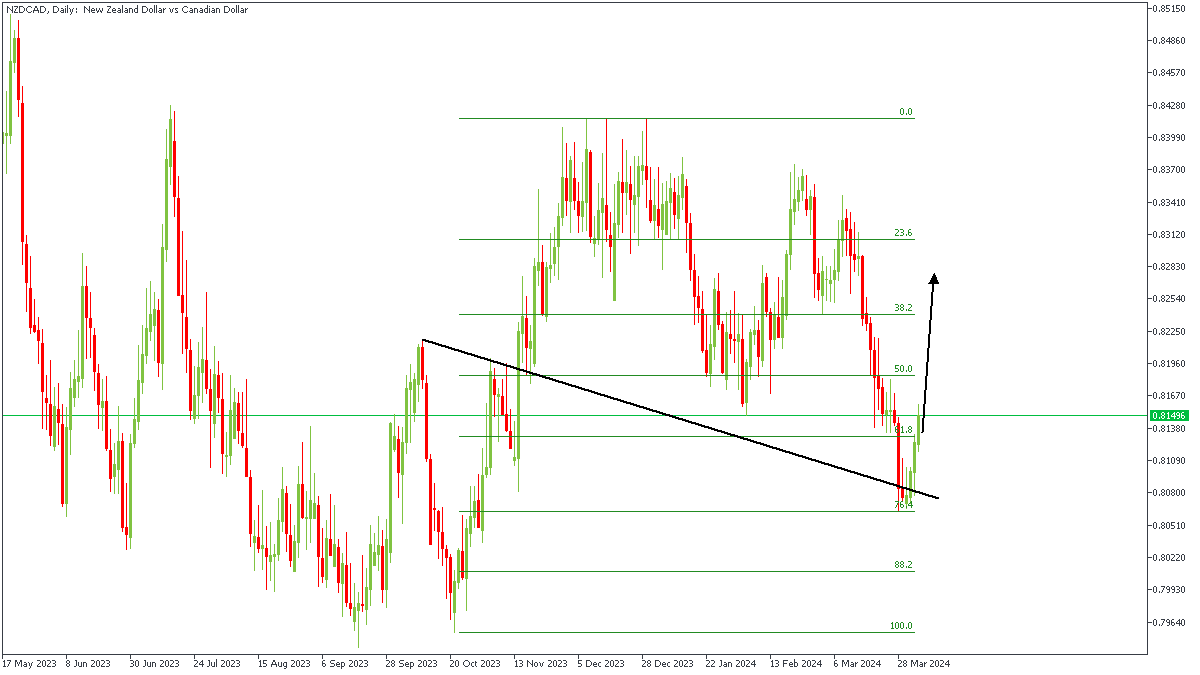
NZDCAD on the daily timeframe recently broke above the previous high as seen on the chart. Following the breakout, price returned to the 76% of the Fibonacci retracement tool for a retest of the confluence between the demand zone, and the trendline support; leading me to anticipate a continued bullish reaction from the trendline support.
Analyst’s Expectations:
Direction: Bullish
Target: 0.82715
Invalidation: 0.80040
USDCAD – D1 Timeframe
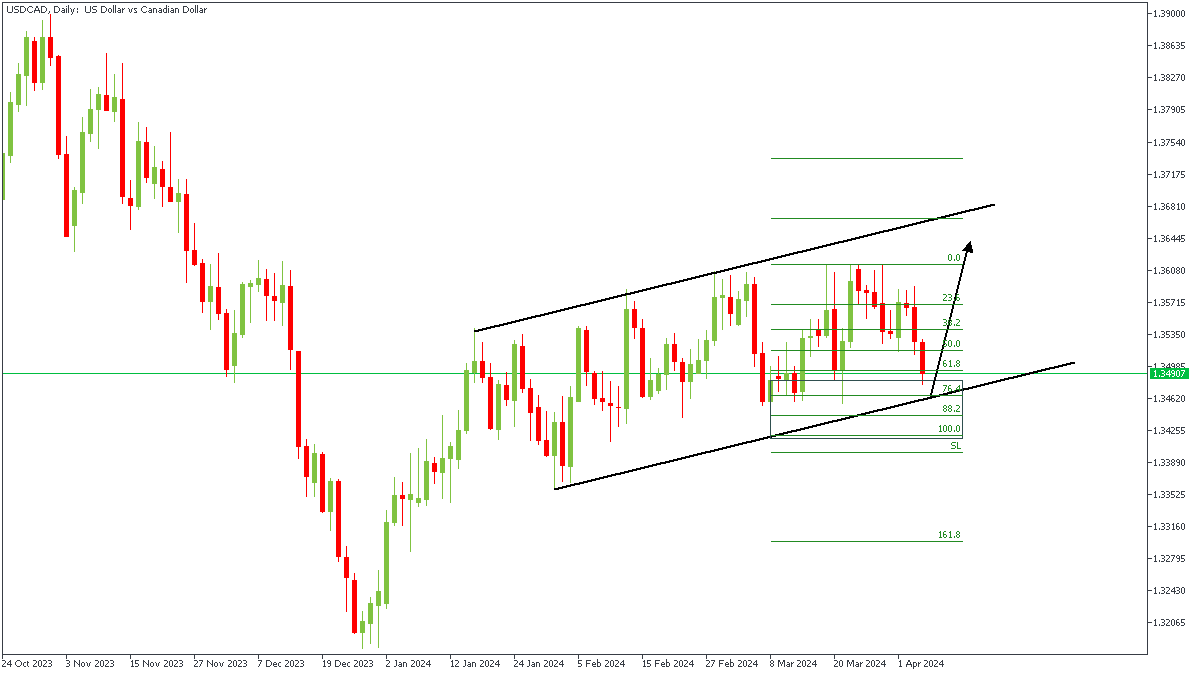
USDCAD seems to be trading within a rising channel, with the recent high rising slightly above the previous. As a result, I have marked out the demand zone, which aligns with the trendline support, and the Fibonacci retracement of the breakout move.
Analyst’s Expectations:
Direction: Bullish
Target: 1.36266
Invalidation: 1.34311
CONCLUSION
The trading of CFDs comes at a risk. Thus, to succeed, you have to manage risks properly. To avoid costly mistakes while you look to trade these opportunities, be sure to do your due diligence and manage your risk appropriately.
You can access more of such trade ideas and prompt market updates on the telegram channel.
