Fundamental Analysis
The US dollar has faced downward pressure recently compared to other major currencies, such as the euro. This trend has been partly attributed to the increasing risk appetite among investors, leading to reduced demand for safe-haven assets like the dollar.
Despite the decrease in expectations for Federal Reserve rate cuts, this factor has been counteracted by investors' perception that the US economy maintains a solid outlook, reducing the central bank's need for additional stimulus measures.
In contrast, the euro has maintained its strength against the dollar due to expectations that the European Central Bank will implement stimulus measures to counteract economic weakness in the eurozone.
US GDP data for the first quarter, along with the Personal Consumption Expenditure Index, will offer a new perception of market sentiment towards the USD, in addition to CPI data in Europe.
Technical Analysis
US Dollar Index (DXY). H4
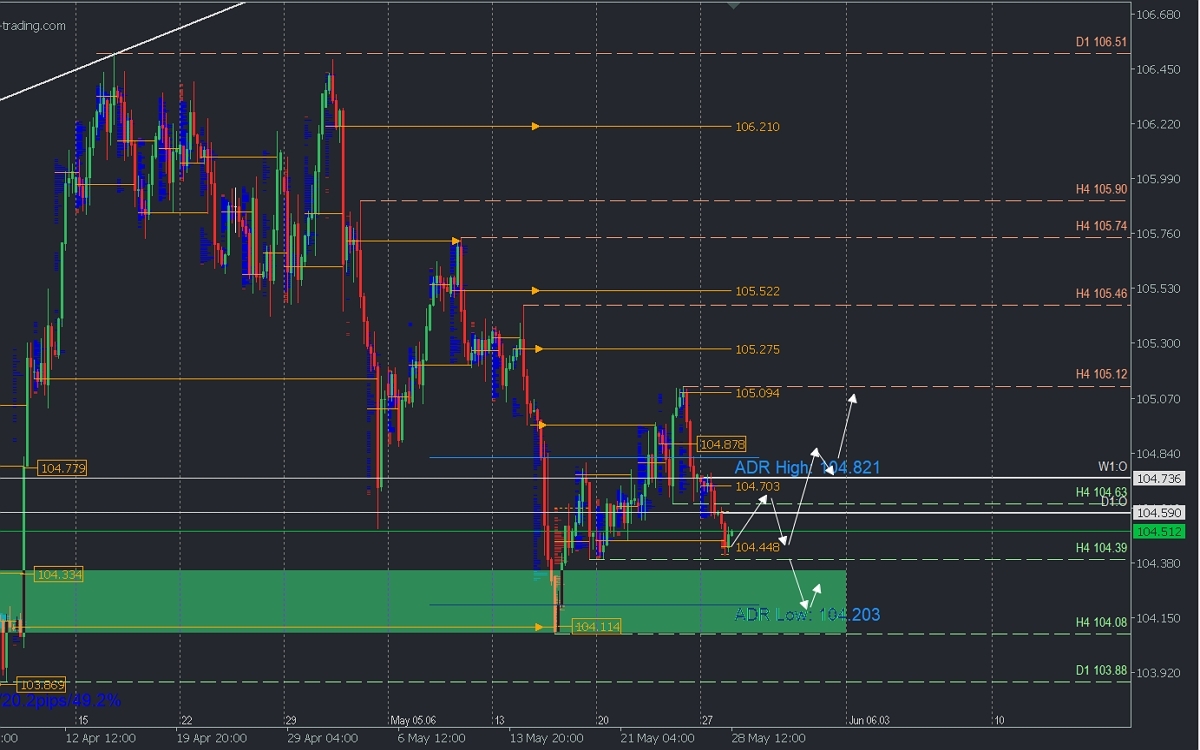
- Bullish Average Daily Range (ADR High): 104.82
- Bearish Average Daily Range (ADR Low): 104.20
- Supply Zones (sells): 104.70/105.09
- Demand Zones (buys): 104.11/104.44
It shows signs of weakness after breaking local support at 104.63, leaving two supply zones at 104.70 and 105.09. However, the decline seeks liquidity in a macro demand zone from last week around 104.47, which is on a broader demand zone from April and May between 104.11 and 104.33, which triggered the price rally two weeks ago.
Broad bullish retracement: Bullish continuation scenario.
A possible rebound is anticipated in the demand zone where the price is currently located. Confirmation of the previously broken level at 104.63 and the uncovered Point of Control (POC) at 104.70 is sought. A break of these levels would indicate greater strength in the bullish market, potentially extending towards daily resistance levels at 104.82, 104.87, and, with greater volatility, towards 105.09 in the coming days. Surpassing last week's resistance at 105.12 would signal further confirmation of the renewed bullish trend.
Limited bullish retracement: Trend reversal scenario.
The price rise towards the nearest supply zone between 104.63 and 104.70 may encounter sufficient bearish defence to provoke a new price drop towards the April and May demand block where the bearish average daily range of 104.20 is located, from where demand is expected to trigger a new rally.
On the other hand, the break of the macro demand zone (green block) indicates greater bearish dominance with attention to the challenge of the key macro uptrend support at 103.88, whose decisive breakthrough or with two confirming bearish moves represents the potential trend reversal.
EURUSD. H3
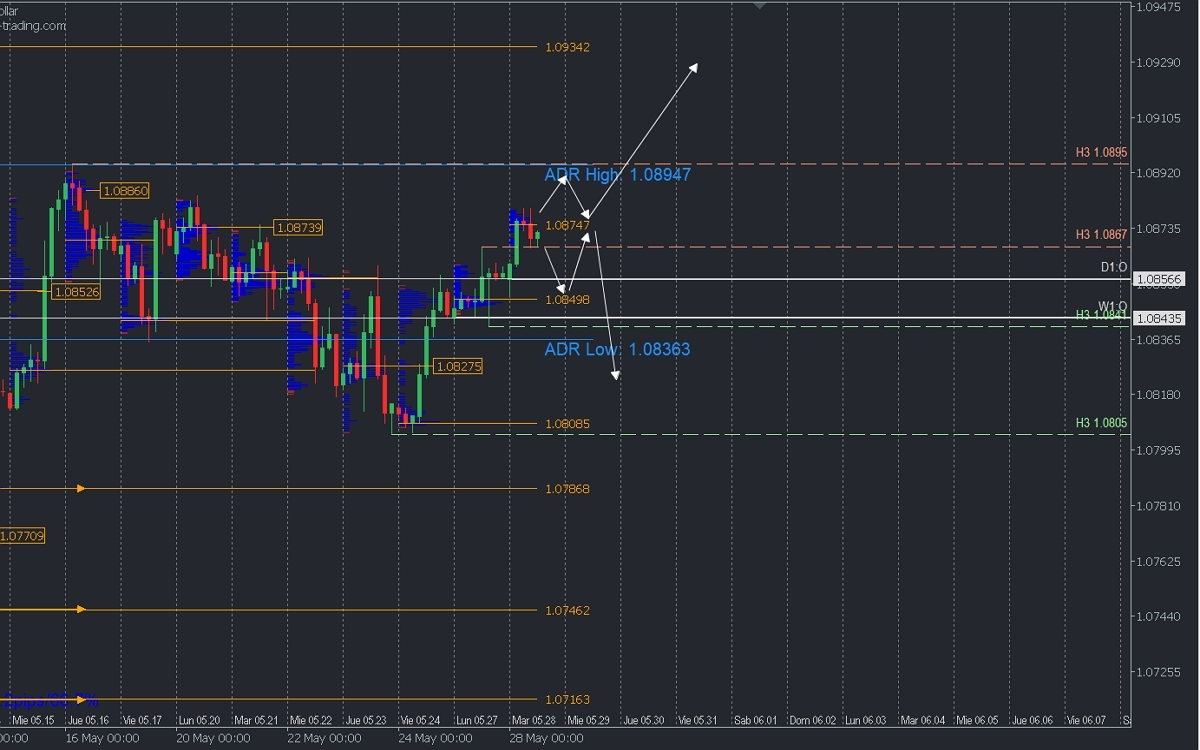
- Bullish Average Daily Range (ADR High): 1.0894
- Bearish Average Daily Range (ADR Low): 1.0836
- Supply Zones (sells): 1.0886
- Demand Zones (buys): 1.0849
As a reflection of the analyzed scenario in the Dollar Index, the weakness of the latter represents the bullish extension for EURUSD, a scenario that we will consider with the price breaking the Asian POC 1.0874 and seeking the extension of buys towards 1.0894 intraday, resistance from May 16 and bullish average daily range, in addition to which its breakthrough will continue seeking liquidity in higher supply zones towards 1.0934.
On the other hand, a drop below the level 1.0867 will encourage a further decline towards 1.0849, being a buy zone, pay attention to the retracement, as if it fails to create a new higher high, the price will fall towards local support 1.0841, causing a bearish reversal.
*Risk Warning
This analysis does not constitute investment advice or an offer to engage in financial transactions. Although all investments involve risks, trading in currencies and other leveraged assets can involve significant losses. A comprehensive understanding of the risks before investing is recommended.
