FBS turns 16

Unlock birthday rewards: from gadgets and dreams cars to VIP trips.Learn more
site icon
Open account
site icon
Open accountLog In
Open account

Dec 19, 2024

Stocks

Nvidia Faces Correction but Shows Signs of Recovery: Key Technical Levels to Watch

Nvidia closed on December 18 at $128.91, marking a decline of approximately 12% from its all-time high of $148.88 recorded on November 7. However, pre-market prices today suggested a recovery of 2.13%, which has already started to fade, positioning the opening price at $131.65. This slight rebound may reflect optimism fueled by analysts’ projections, who remain bullish despite the correction.

The 10% technical correction, partially driven by the recent antitrust investigation in China, has not altered long-term perspectives. Bank of America and Bernstein have reiterated Nvidia as their "top pick," with price targets of $190 and $175, respectively. Furthermore, Bernstein anticipates a solid 2025 for the company, supported by its transition from Hopper to Blackwell chips, which could be pivotal for its future performance.

Monitoring whether the current pre-market levels act as support will be crucial, along with assessing whether the bullish projections generate enough momentum to resume an upward trend—especially given Nvidia's outstanding performance in 2024 (+165%).

Technical Analysis
Nvidia, H4

NVIDIA.jpg
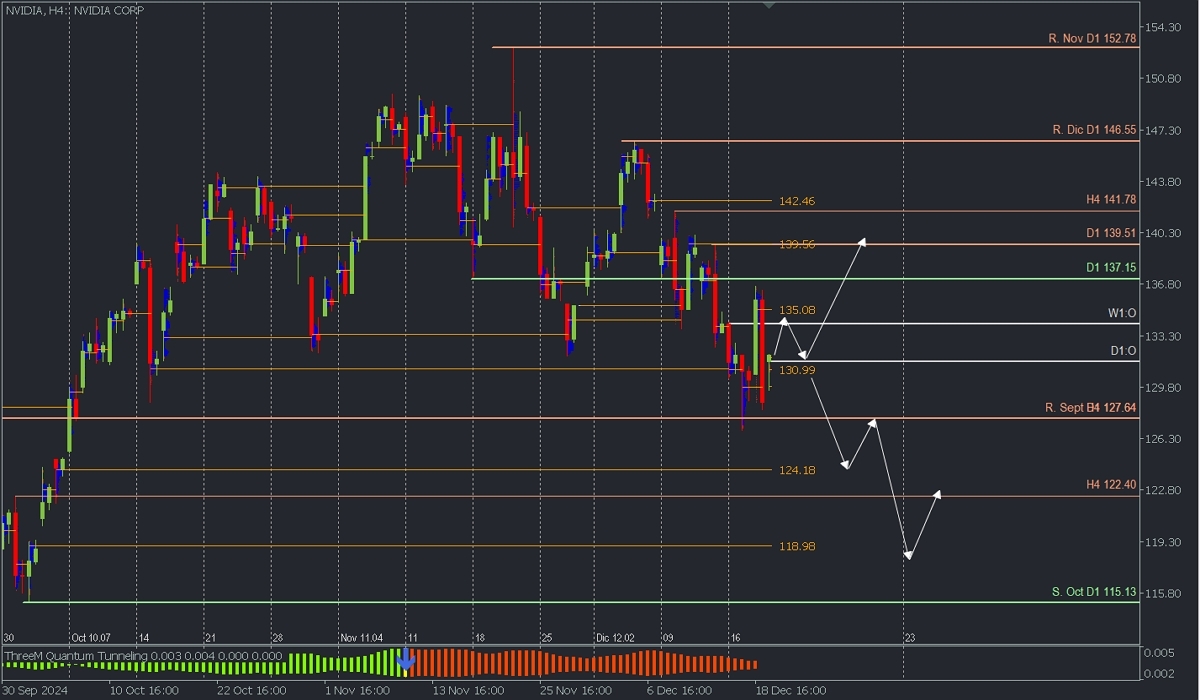
  • Supply Zones (Sell): 135.08, 139.56 y 142.46
  • Demand Zones (Buy): 130.99, 124.18 y 118.98

Nvidia has entered a macro correction, triggering an intraday and daily trend reversal after breaking the confirmed support at 137.15 on November 18. Following today’s opening gap, the price might retrace towards the supply zone around 135.08. A breakout above this level could renew buying interest towards the intraday validated resistance at 139.51, which aligns with a key uncovered Point of Control (POC) and supply zone. Once breached, the bullish trend could extend towards the next supply zone near 142.46.

Conversely, if bears defend the supply zone at 135.08 and the price breaks the demand zone around 130.99, Nvidia's stock could continue falling, targeting the next demand zones around 124.18 and 118.98 in the coming days.

Technical Summary

  • Bullish Scenario: Buy positions above 131.00 (after forming and confirming an Exhaustion/Reversal Pattern (ERP) in M5) with targets at 135.00, 137.15, and 139.50 as extensions.
  • Bearish Scenario: Sell positions below 130.00 with targets at 127.64, 124.18, 122.40, and 119.00.

Always wait for the formation and confirmation of an Exhaustion/Reversal Pattern (ERP) in M5 as taught here before entering trades at the key levels mentioned above.

Key Notes:

  • Uncovered POC: A POC (Point of Control) is the price level where the highest volume concentration occurred. If a downward movement followed this level, it is considered a sell zone, forming resistance. Conversely, if an upward movement followed, it is considered a buy zone, typically forming support.

Trading foreign currencies on margin involves significant risks and may not be suitable for everyone, as high leverage can increase both potential gains and losses. Before entering the foreign exchange market, it is essential to evaluate your investment goals, personal experience, and risk tolerance.

Share with friends:
Tibisay Ramos

Author: Tibisay Ramos

Open an FBS account

By registering, you accept FBS Customer Agreement conditions and FBS Privacy Policy and assume all risks inherent with trading operations on the world financial markets.

Latest news

Feb 27, 2025

15:15

US500 Technical Analysis (27th Feb.)

Stocks

Feb 21, 2025

11:55

S&P 500 Drop: Fundamental and Technical Factors

Stocks

Feb 19, 2025

14:35

Nvidia: Market Outlook, Key Risks, and Investment Potential

Stocks

Feb 14, 2025

14:47

Google Technical Analysis (14th Feb.)

Stocks

FBS at social media

iconhover iconiconhover iconiconhover iconiconhover icon

Contact us

iconhover iconiconhover iconiconhover iconiconhover icon
store iconstore icon
Get on the
App Store
store iconstore icon
Get on the
Google Play

Trading

Company

About FBS

Legal documents

Company news

FC Leicester City

Help Center

Partnership programs

The website is operated by FBS Markets Inc.; Registration No. 000001317; FBS Markets Inc. is registered by the Financial Services Commission under the Securities Industry Act 2021, license number 000102/6. Office Address: 9725, Fabers Road Extension, Unit 1, Belize City, Belize.

FBS Markets Inc. does not offer financial services to residents of certain jurisdictions, including, but not limited to: the USA, the EU, the UK, Israel, the Islamic Republic of Iran, Myanmar.

Payment transactions are managed by HDC Technologies Ltd.; Registration No. HE 370778; Legal address: Arch. Makariou III & Vyronos, P. Lordos Center, Block B, Office 203, Limassol, Cyprus. Additional address: Office 267, Irene Court, Corner Rigenas and 28th October street, Agia Triada, 3035, Limassol, Cyprus.

Contact number: +357 22 010970; additional number: +501 611 0594.

For cooperation, please contact us via [email protected].

Risk Warning: Before you start trading, you should completely understand the risks involved with the currency market and trading on margin, and you should be aware of your level of experience.

Any copying, reproduction, republication, as well as on the Internet resources of any materials from this website is possible only upon written permission.

The information on this website does not constitute investment advice, a recommendation, or a solicitation to engage in any investment activity.