Nvidia stock fell 8% to $103, significantly outpacing the Nasdaq Composite index's 2% decline. The stock is now down 27% from its June peak, marking its worst monthly performance since September 2022. Nvidia's market capitalization has dropped by about $795 billion from its record high in June, erasing more value than Tesla's total market cap in just six weeks. This decline is due to a combination of profit-taking, a broader tech stock slump, and geopolitical concerns affecting semiconductor stocks. Despite the drop, Nvidia is expected to be the largest contributor to second-quarter earnings growth in the S&P 500, with analysts projecting significant income growth and a strong stock rebound.
GM – H4 Timeframe
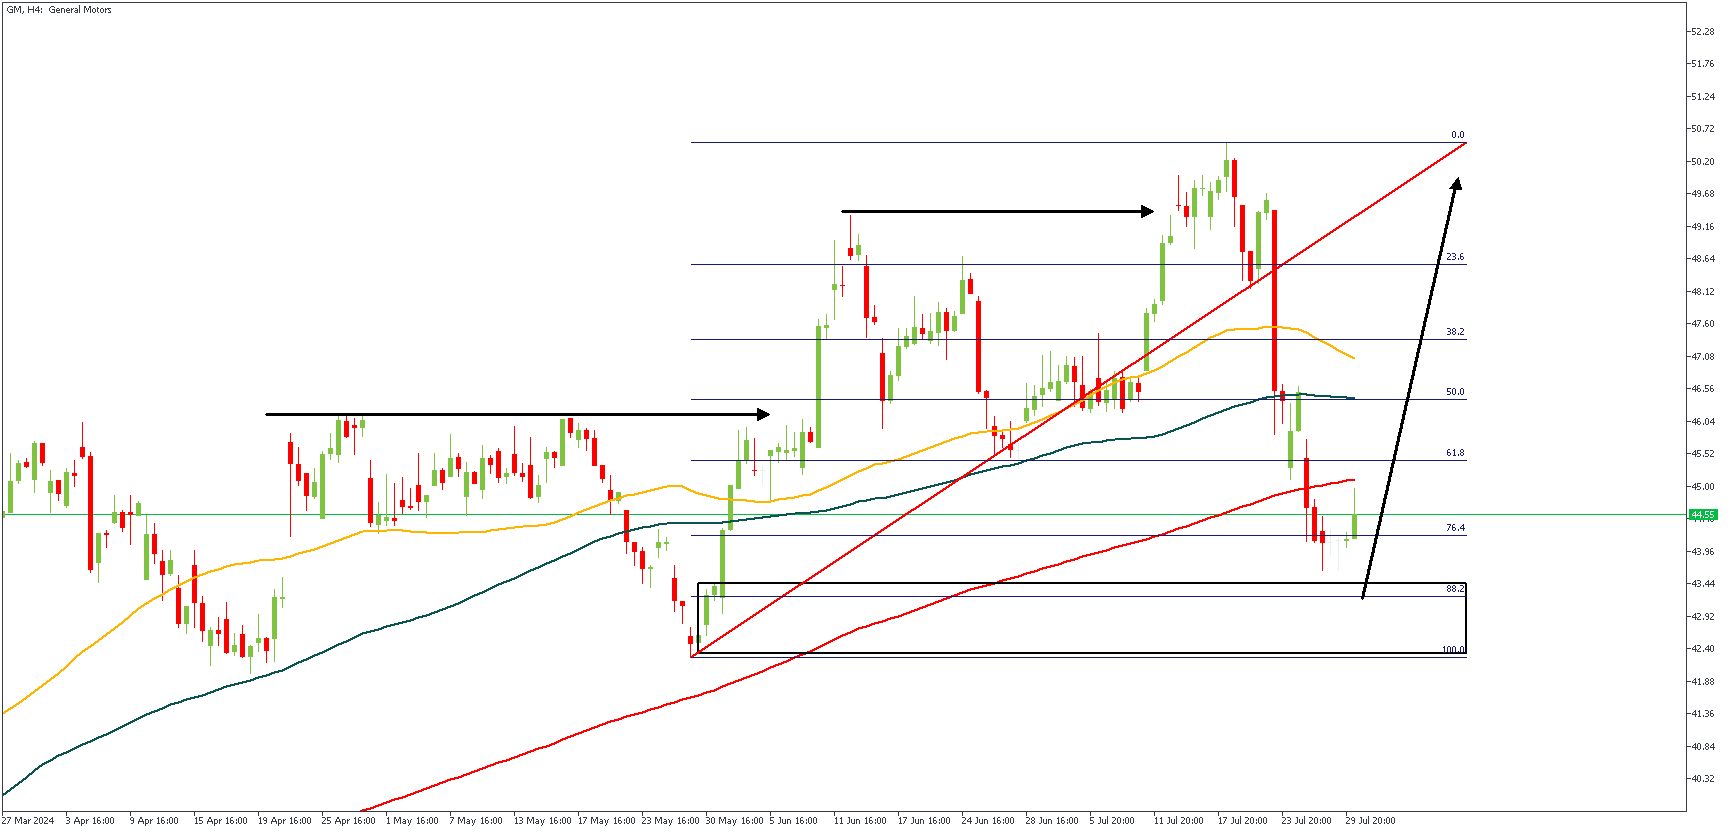
The 4-hour timeframe of General Motors’ price action chart shows price heading into a crucial drop-base-rally demand zone which lines up perfectly with the 200-period moving average; the bullish array of the moving averages adds to the confluence in favor of a bullish outcome. The 88% of the Fibonacci retracement tool provides the final argument for a bullish sentiment.
Analyst’s Expectations:
Direction: Bullish
Target: 49.68
Invalidation: 41.91
Nvidia – H4 Timeframe
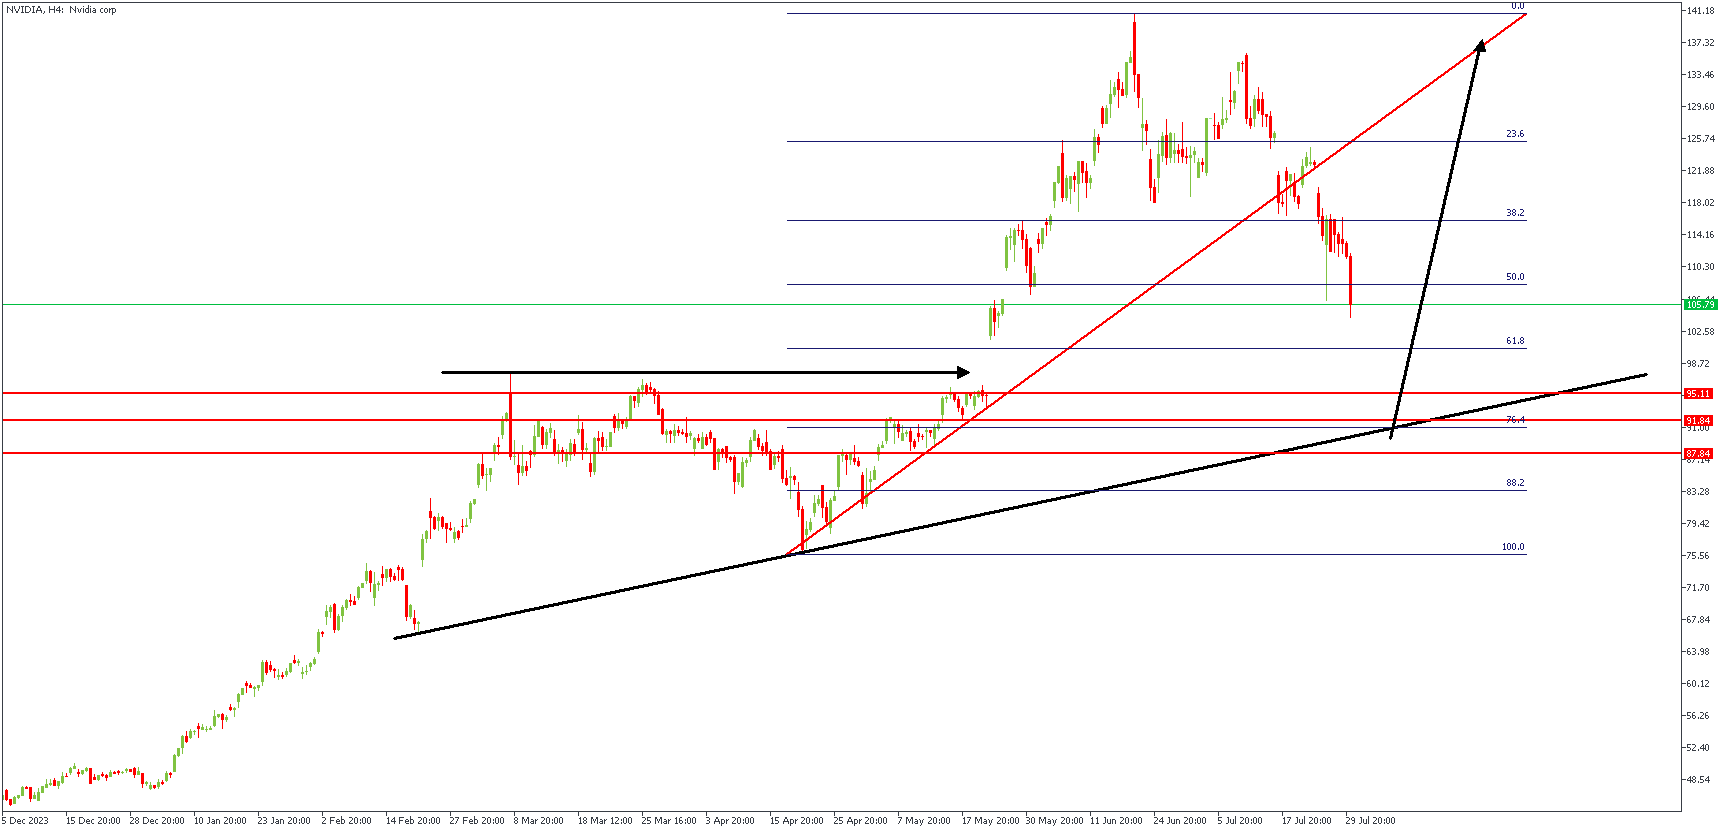
Nvidia has had a tremendous run for a couple of days, as evidenced by the long bullish swing. Following such a big move, it is only reasonable to have a retracement that would lead to the onset of the next impulse – as is the case on the 4-hour timeframe chart of Nvidia as seen. In addition, the daily timeframe pivot zone, 76% of the Fibonacci retracement zone, and the trendline support provide the crucial confirmation in favor of the bullish sentiment.
Analyst’s Expectations:
Direction: Bullish
Target: 137.40
Invalidation: 78.80
CONCLUSION
You can access more of such trade ideas and prompt market updates on the telegram channel.
