Fundamental Analysis
The Nasdaq 100 (US100) started the week with a sharp correction, dropping 1.9% on Tuesday, weighed down by weakness in tech stocks, particularly Nvidia, which fell more than 6% after reaching an all-time high the previous day. Mixed economic data, such as the increase in the ISM services PMI prices paid index (64.4 vs. 58.2 prior) and a rise in November job openings, heightened concerns about persistent inflation, reducing expectations for Federal Reserve rate cuts before June.
In this context, the 10-year Treasury yield climbed 7 basis points to hover near 4.7%, reflecting uncertainties about the direction of monetary policy. Investors remain cautious ahead of Friday’s labour market data, which could provide further clarity on the economic outlook. This environment of shifting monetary policy bets and movements in the tech sector continues to create a volatile scenario for the Nasdaq 100.
Technical Analysis
US100, H1
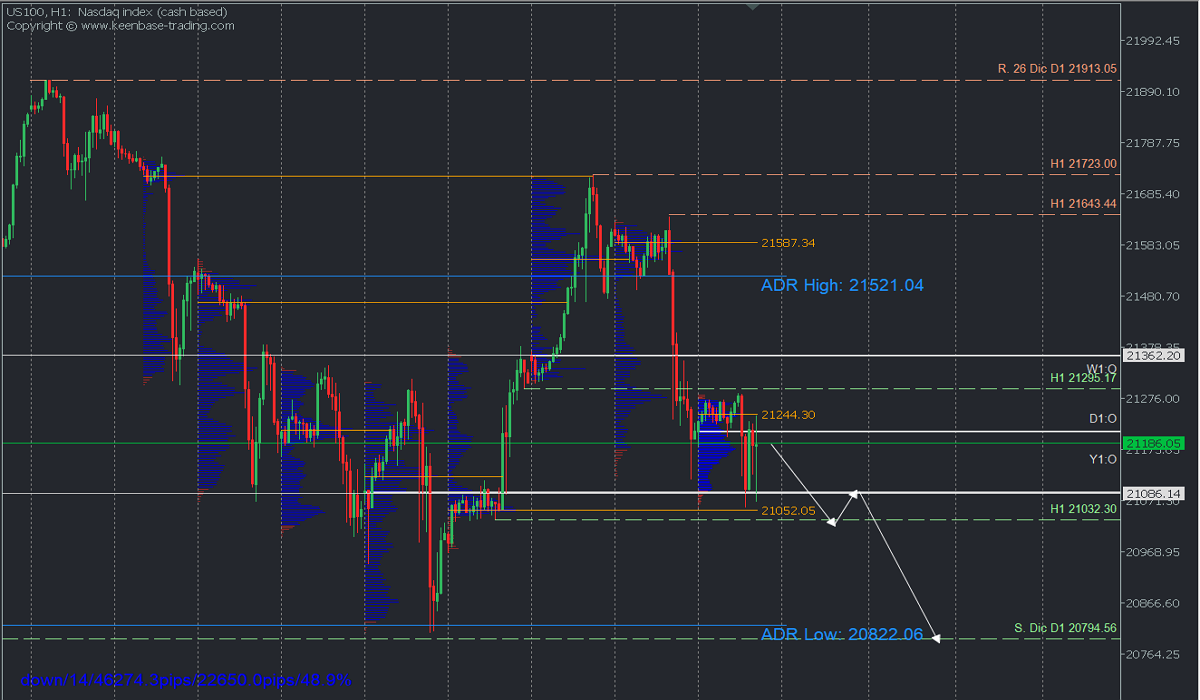
Supply Zones (Sell): 21244.30 and 21587.34
Demand Zones (Buy): 21052.05
The recovery attempt was invalidated after breaking the key intraday support at 21295.17, leaving an uncovered POC* on Tuesday at 21587.34 and the daily POC near 21244.30. Both are acting as key supply zones, triggering selling orders.
From a volume perspective, price shows an accumulation of sell orders. Following a moderate bullish reaction to Friday’s POC at 21064, bears are expected to dominate, driving the price below 21000 toward December’s support at 20794.56 in the short term, with a target of December lows between 20630 and 20320.
Technical Summary
Bearish Scenario: Sell below 21244.30 with targets at 21000, 20795, and 20600 in extension.
Bullish Scenario: Buy above 21296 (after the formation and confirmation of a PAR*) with targets at 21300, 21400, and 21500 in extension.
Always wait for the formation and confirmation of a Reversal/Exhaustion Pattern (PAR) on M5, as shown here, before entering any trades in the key zones indicated.
*Uncovered POC: POC = Point of Control. This is the level or zone where the highest volume concentration occurred. If it preceded a bearish move, it is considered a sell zone and acts as resistance. Conversely, if it preceded a bullish move, it is considered a buy zone, usually located at lows, forming support zones.
