- Bullish corrective scenario: Buy above 37450 with TP: 37800, TP2: 37866, and TP3: 38100, with a stop loss below 37297 or at least 1% of the account capital. Apply trailing stop.
- Bearish continuation scenario (after the rally): Sell below 37866 with TP1: 37479, TP2: 37297, and TP3: 37000 with a stop loss above 38000 or at least 1% of the account capital.
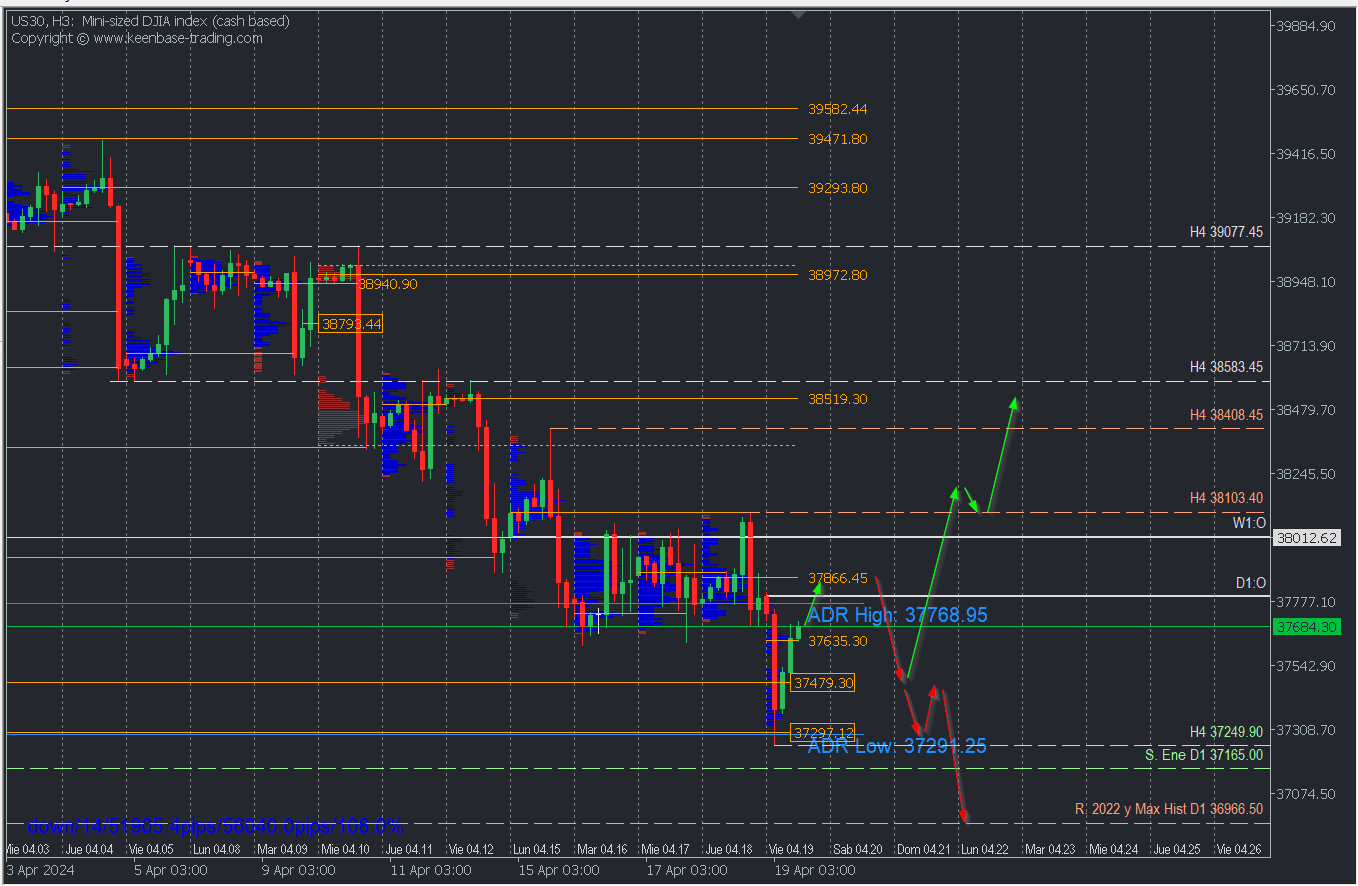
Scenario from the H4 chart:
Volume Point of Control (POC): 37866.45 (Sell Zone) // 37479.307 37297.12 (Buy Zone)
The downward correction extends towards the January buy zone, leaving support at 37249.90, very close to January's support at 37165 and the broken 2022 resistance at 39966.50, which now acts as support.
This decline in the Asian session was driven by risk aversion following the recent Israeli attacks on an Iranian military base, pushing the price towards the daily bearish average range.
Intraday Expectation
The immediate reaction to the reached buy zones has been bullish, breaking the Asian POC at 37635.30, opening the possibility of a more extended rally towards yesterday's uncovered POC at 37866.45, an intraday sell zone that, if defended by the bears, could lead to a new price decline at least towards 37635 and 37479 in extension.
Bullish reversal scenario
If the quotes fail to drop below the buy zones shown and don't break the support at 37249.90, it may indicate the start of a bullish reversal. This will be confirmed once there is a decisive or confirmed breakout with a second resistance peak at 38103.40, which was yesterday's high. There is a possibility of further upward movement towards 38408.45, followed by the next sell zone around 38519.30 next week.
Bearish continuation
This scenario will become evident with a stronger bearish reaction from the sell zone around 37866.45, decisively breaking the buy zones between 37635 and 37297, causing the breakout of the hot support at 37249.90 and possible extension towards the key level 39966.50 in the coming week.
*Uncovered POC: POC = Point of Control: It is the level or zone where the highest volume concentration occurred. If there was a previous downward movement from it, it is considered a sell zone and forms a resistance zone. On the contrary, if there was a previous upward impulse, it is considered a buy zone, usually located at lows, forming support zones.
Risk Warning
This analysis does not constitute investment advice or an offer to participate in financial transactions. Although all investments involve risks, trading forex and other leveraged assets can involve significant losses. A comprehensive understanding of the risks is recommended before investing.
