The Bank Nifty index has shown bullish momentum, supported by a bullish engulfing pattern and a positive RSI crossover, suggesting a move towards 53,300 if it stays above 52,000. Similarly, the Nifty index remains positive, with a potential rise to 25,000 as long as it holds above 24,500. On Tuesday, major indices hit new highs, driven by strong IT stock performance and a weakening rupee, though broader market gains were limited by high valuations and sector rotation. Investor optimism was fueled by strong quarterly reports from leading IT firms and expectations of improved rural consumption. Overall, the market sentiment remains cautiously optimistic, with key support levels being closely watched.
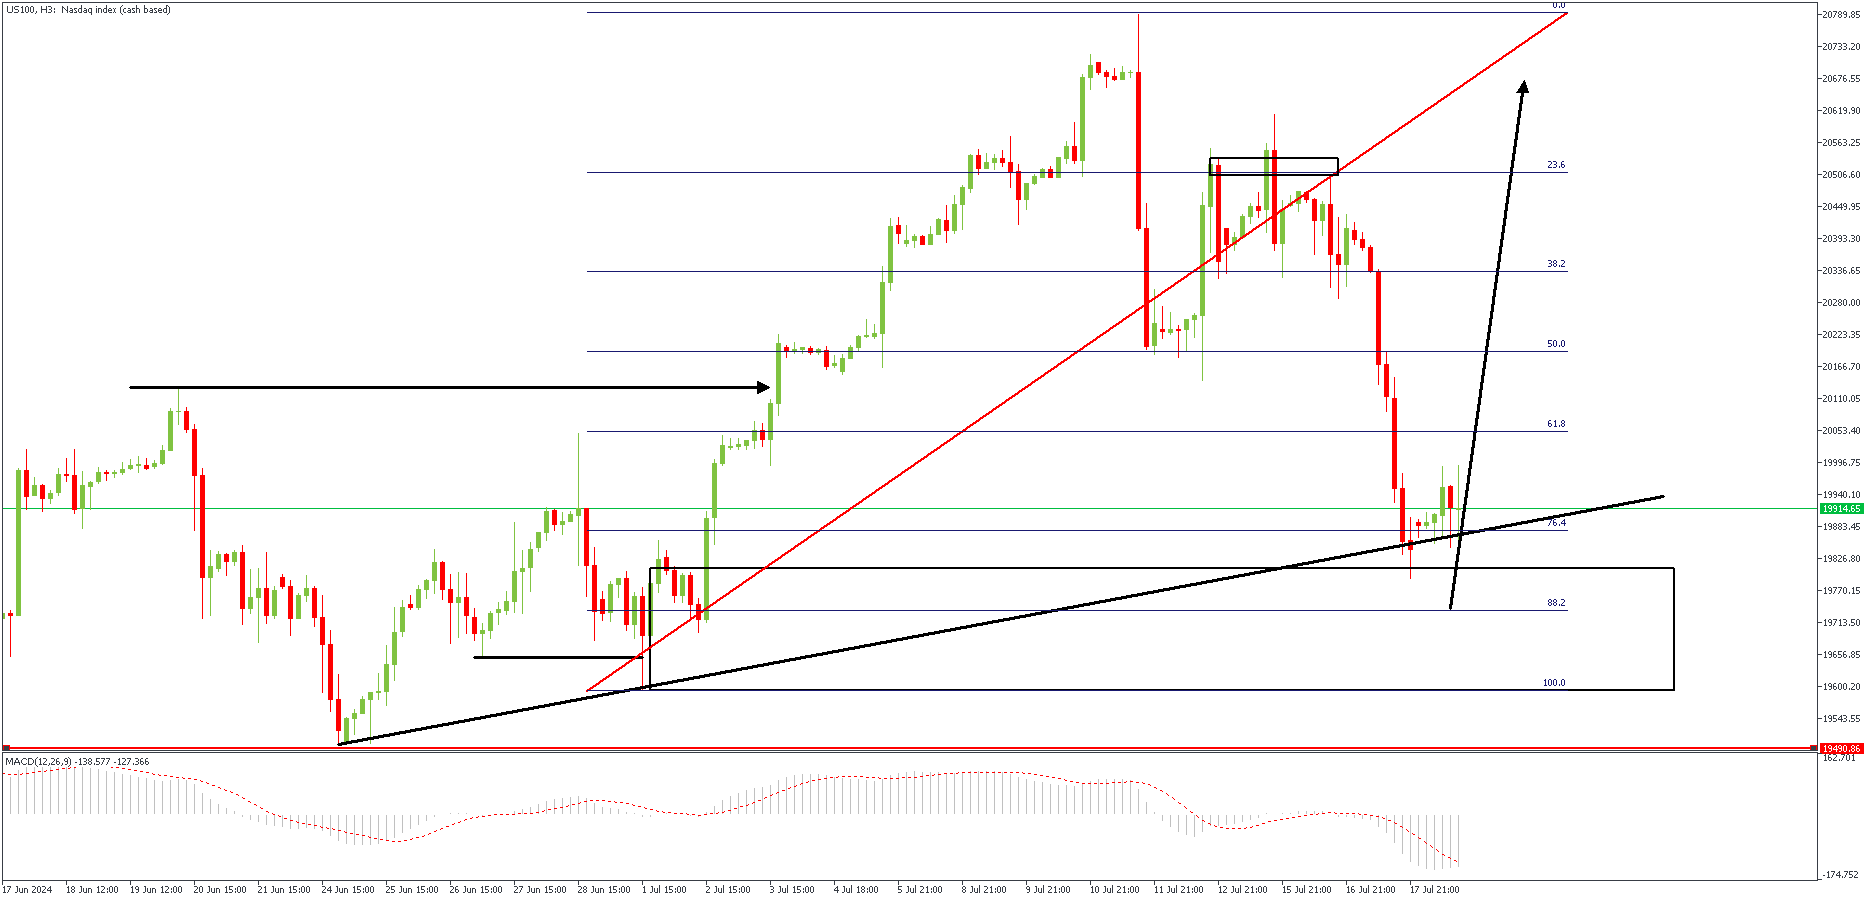
US100 – H3 Timeframe

The 3-hour timeframe of US100 (Nasdaq) shows the recent break of structure, as well as the retracement that followed. The Fibonacci retracement tool reveals that price is currently trading around the 88% of the Fibonacci, thus indicating the likelihood of a reversal. Also, the presence of a trendline support, a SBR price action pattern, and the drop-base-rally demand zone serve as a confluence for the bullish sentiment.
Analyst’s Expectations:
Direction: Bullish
Target: 20697.00
Invalidation: 19500.00
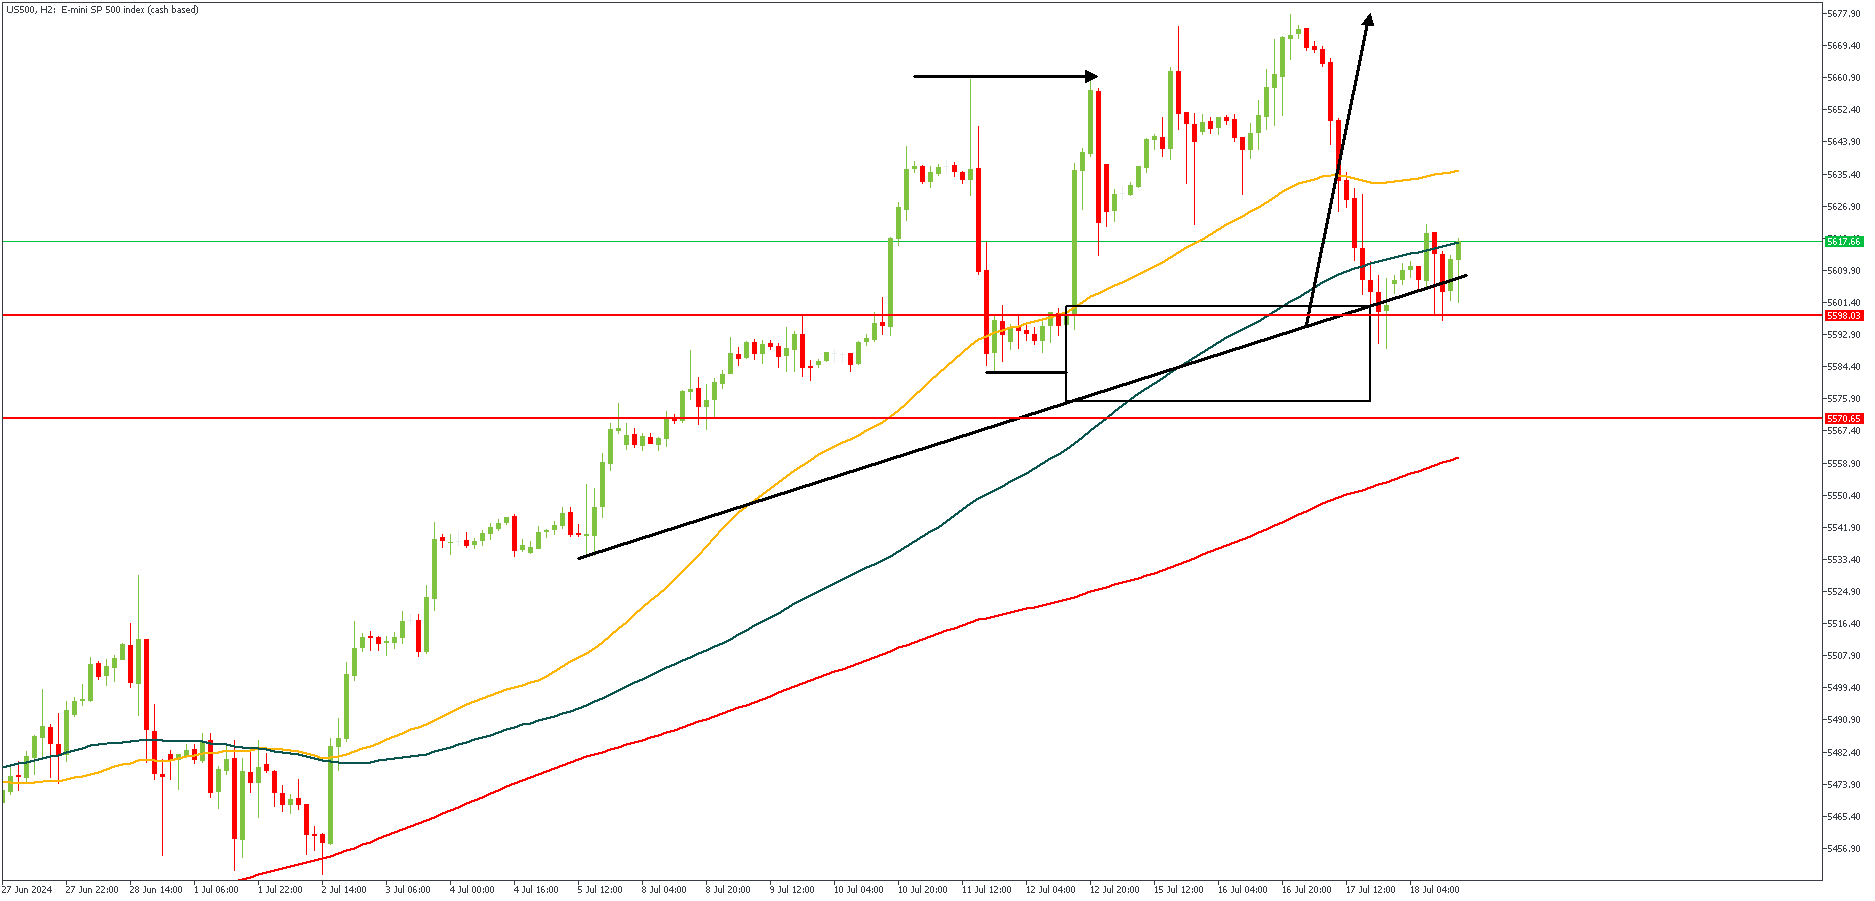
US500 – H2 Timeframe

On the 2-hour timeframe chart of US500, we see a compelling argument in favor of the bullish sentiment based on the confluence of the trendline support, the SBR price action pattern, the demand zone, as well as the daily timeframe pivot zone.
Analyst’s Expectations:
Direction: Bullish
Target: 5673.0
Invalidation: 5567.0
CONCLUSION
You can access more of such trade ideas and prompt market updates on the telegram channel.
