Fundamental Analysis
The US500 is experiencing volatility, reaching an all-time high of 5,778.31 during the European morning on September 26, 2024, driven primarily by expectations of further rate cuts from the Federal Reserve and statements by Chairman Jerome Powell, indicating continued support for monetary easing, which benefits corporate financing.
Moreover, the continuous decline in the VIX, approaching its multi-year support and demand zone around 12.38, suggests increased confidence and risk appetite. Historically, when the VIX is below 15, the S&P 500 tends to form tops. This also serves as a sign of a peak or trough, potentially anticipating a reversal in the S&P 500 ahead of the U.S. elections.
Technical Analysis
US500, H2
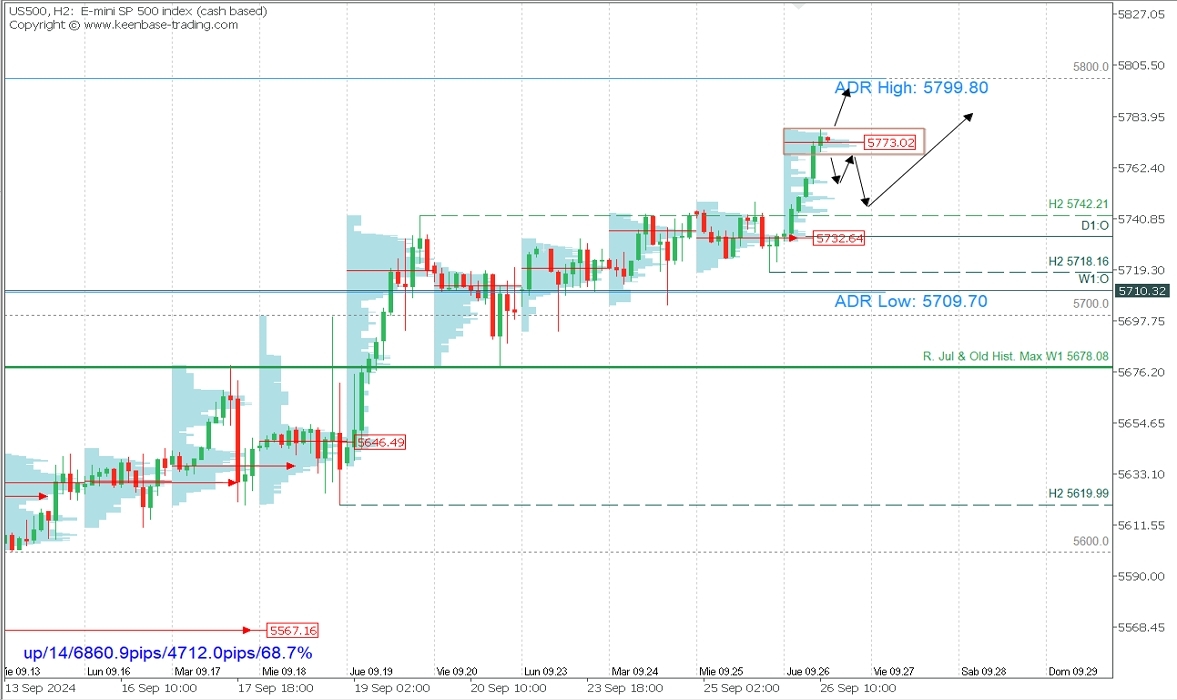
Supply Zones (Sells): 5773.02
Demand Zones (Buys): 5732.64
After the moderate consolidation this week, prices rebounded to reach new all-time highs, hitting 5,778.31 in the European morning and forming a volume concentration around 5773.02. If the price continues moving above this key European volume zone, an upward continuation is expected, targeting the 5800 level.
Conversely, if the price moves below this volume zone, a correction might develop toward the recent Asian demand zone between 5756 and 5750, or even the broken resistance at 5742, where bulls could defend their positions.
It's essential to note that the last validated intraday support for the uptrend is at 5718.16, which implies that we remain in a buying stance as long as this support holds. While the market sentiment is bullish, the signals from the VIX reaching historical lows could indicate a potential short-term shift.
Technical Summary:
Bullish Continuation Scenario: Buy above 5780 with TP at 5800.
- Bearish Scenario: Sell below 5768 with TP at 5756, 5750, or 5743 in extension.
Bullish After Retracement: Buy above 5743 with TP at 5780 and 5800 in extension.
VIX, Daily
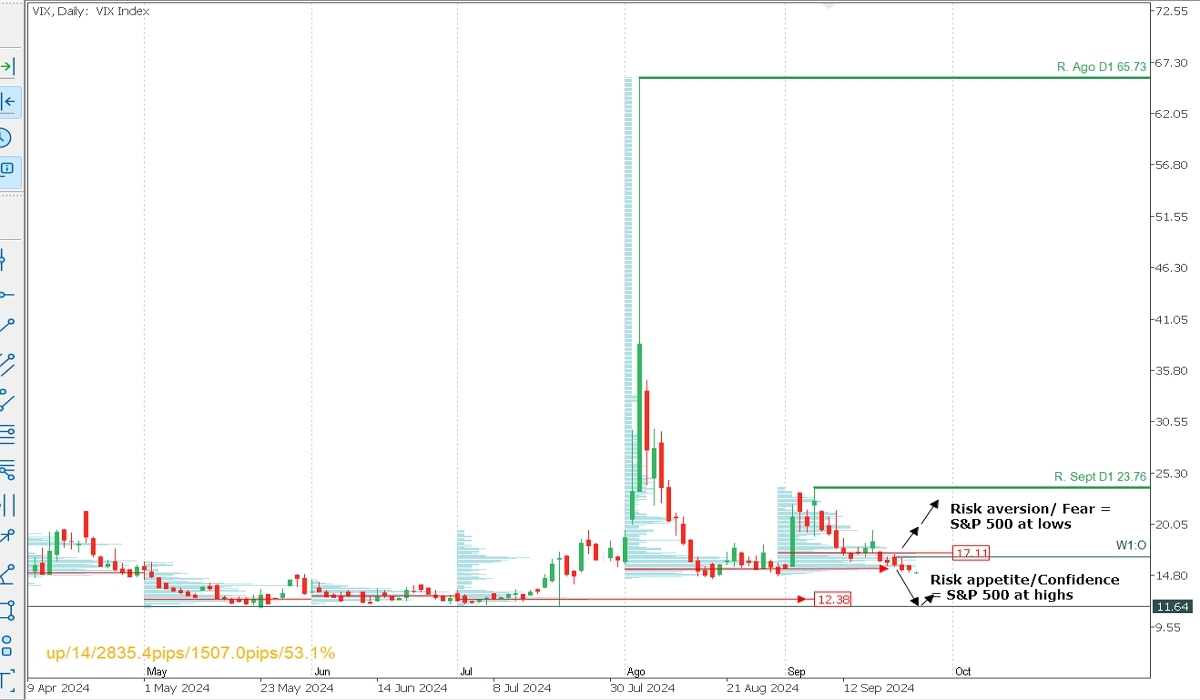
Supply Zones (Sells): Monthly POC: 17.11
Demand Zones (Buys): August POC: 15.45, July POC: 12.38
The VIX is compressed in September, currently around the August demand zone of 15.45, which could activate bulls and trigger a new correction in the S&P 500. However, a fall below this zone could target the liquidity area around the July zone at 12.38, approaching a multi-year historical support level that typically causes a VIX rebound and a subsequent S&P 500 drop.
The VIX below 15 indicates risk appetite, coinciding with this year's S&P 500 peaks. Conversely, a higher VIX signals increased volatility and risk aversion, often aligning with S&P 500 declines. Monitoring the VIX rebound will help anticipate changes in market sentiment, so analysing it before continuing S&P 500 buying positions is highly recommended.
Uncovered POC Explained: POC (Point of Control) is where the highest volume concentration occurred. If it was followed by a bearish move, it’s considered a sell zone (resistance). Conversely, if followed by a bullish move, it’s a buy zone (support), usually located at lows.
