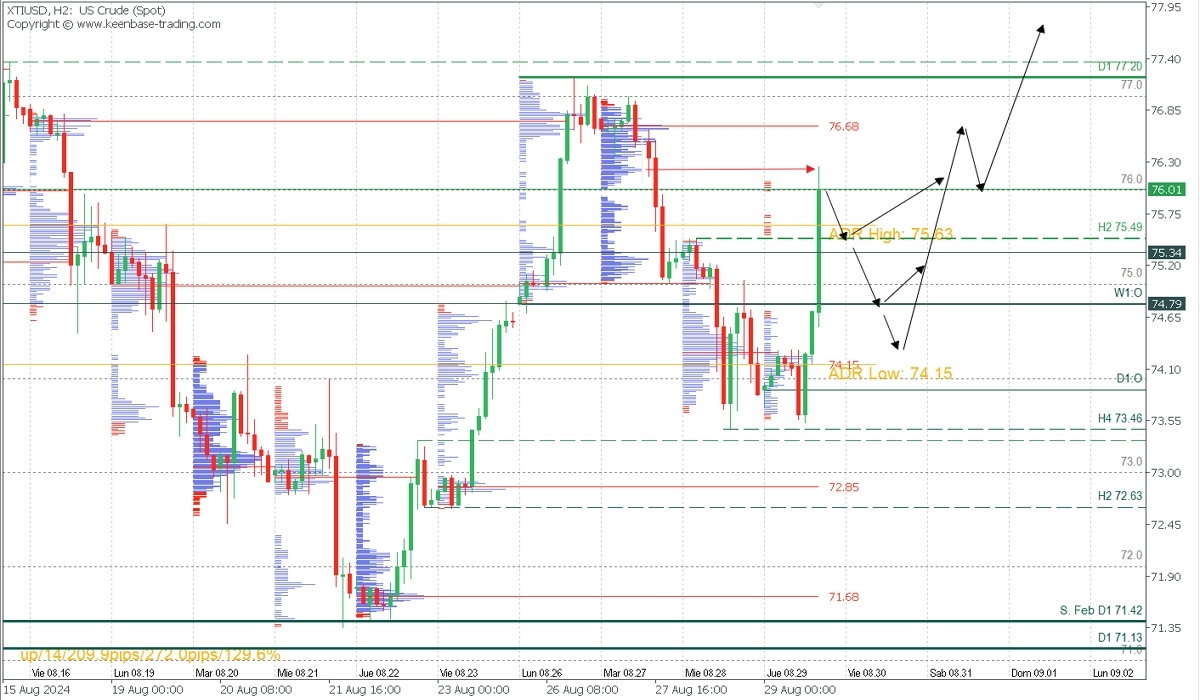
- Bearish Corrective Scenario: Sell positions below 75.40 with TP1: 75.00 and TP2: 74.50, with S.L. at 76.00 or at least 1% of the account's capital.
- Bullish Scenario: Buy positions above 75.50 (if a PAR* forms and confirms), otherwise, wait for a pullback towards 75.00 or 74.50. With TP1: 76.68, TP2: 77, and TP3: 77.50 in extension. Place S.L. below 75.30 or at least 1% of the account's capital. Apply Trailing Stop.
Fundamental Analysis
Some drivers for the recent crude oil price surge:
Positive U.S. Economic Data: Strong economic growth figures from the U.S. have led to increased optimism about future oil demand. Better-than-expected GDP growth indicates resilience in the U.S. economy, the world's largest oil consumer, suggesting higher crude demand.
Market Sentiment and Technical Factors: After a recent decline, technical buying opportunities likely emerged, reinforcing the rally.
Lack of Significant Negative News: Sometimes, the absence of new negative developments (such as geopolitical tensions or unexpected economic slowdowns) can itself be a reason for prices to stabilize or rally, as traders adjust their positions, especially near the end of the month.
Technical Analysis
XTIUSD, H2

- Supply Zones (Sell): 76.68
- Demand Zones (Buy): 74.15
The price rally after the U.S. market opened decisively broke through the last significant resistance of the week's bearish movement at 75.49, moving within the average bullish range, seeking sell liquidity zones. A pullback to the broken level or more extensively to the weekly open at 75.79 or 74.30, covering the volume inefficiency, could trigger a new rally towards the uncovered POC* at 76.68, a sell zone that bears will defend, with an expected bearish reaction targeting the latest demand zones before resuming buys above 77.00.
This bullish reversal scenario will remain valid as long as the next pullback does not fall below the last support at 73.46. Instead, watch for the formation of exhaustion/reversal patterns in key zones such as around 75.50, and 74.80, or if the bearish trend continues, around 74.30.
*POC: Point of Control - This is the level or zone where the highest volume concentration occurred. If a bearish movement follows from it, it’s considered a sell zone and forms a resistance area. Conversely, if a bullish impulse follows, it’s regarded as a buy zone, usually located at lows, forming support areas.
