US30, H4
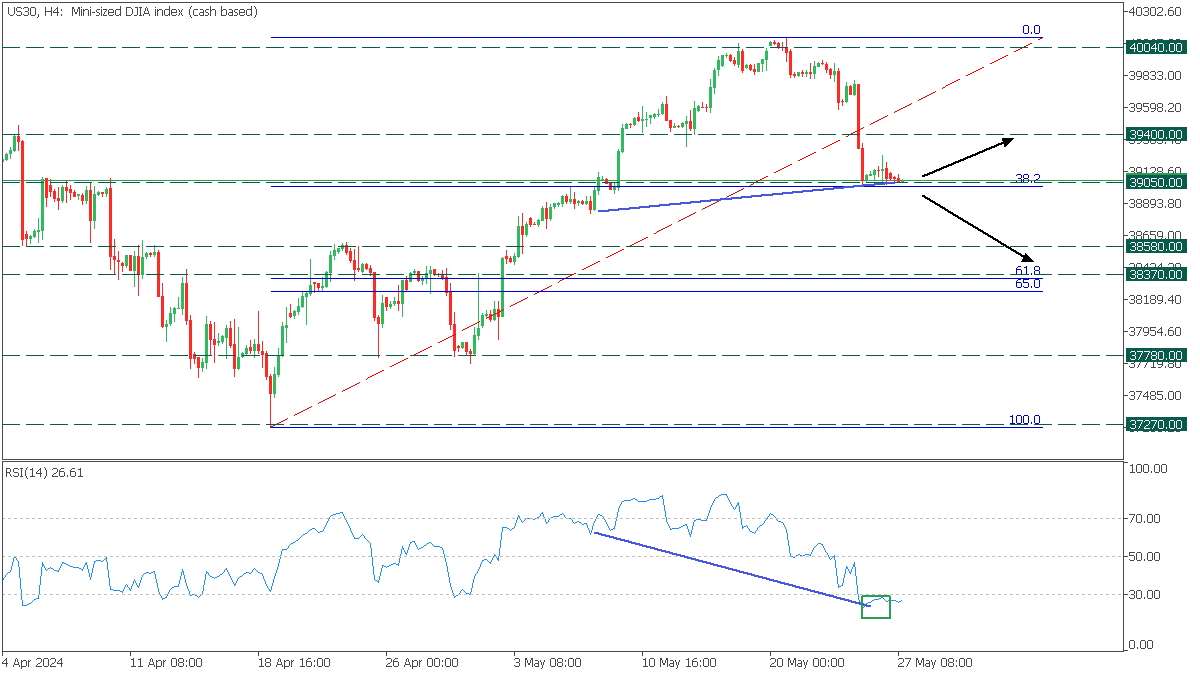
In the H4 time frame, US30, in a correction after a long-term bullish trend and reached a 39050 support level, aligned with the 38.2 Fibonacci ratio. The RSI oscillator indicatesa bullish divergence with the asset, giving an extra bullish sentiment.
- If the price rebounds from the 39050 level, it will likely rise to the 39400.
- However, if the US30 breaches below the support, it will drop the asset to 38370.
Conclusion
In conclusion, trading CFDs carries inherent risks. Success in this field demands effective risk management. To minimize costly errors and capitalize on trading opportunities, it's crucial to conduct thorough due diligence and manage risks diligently.