XBRUSD, Daily

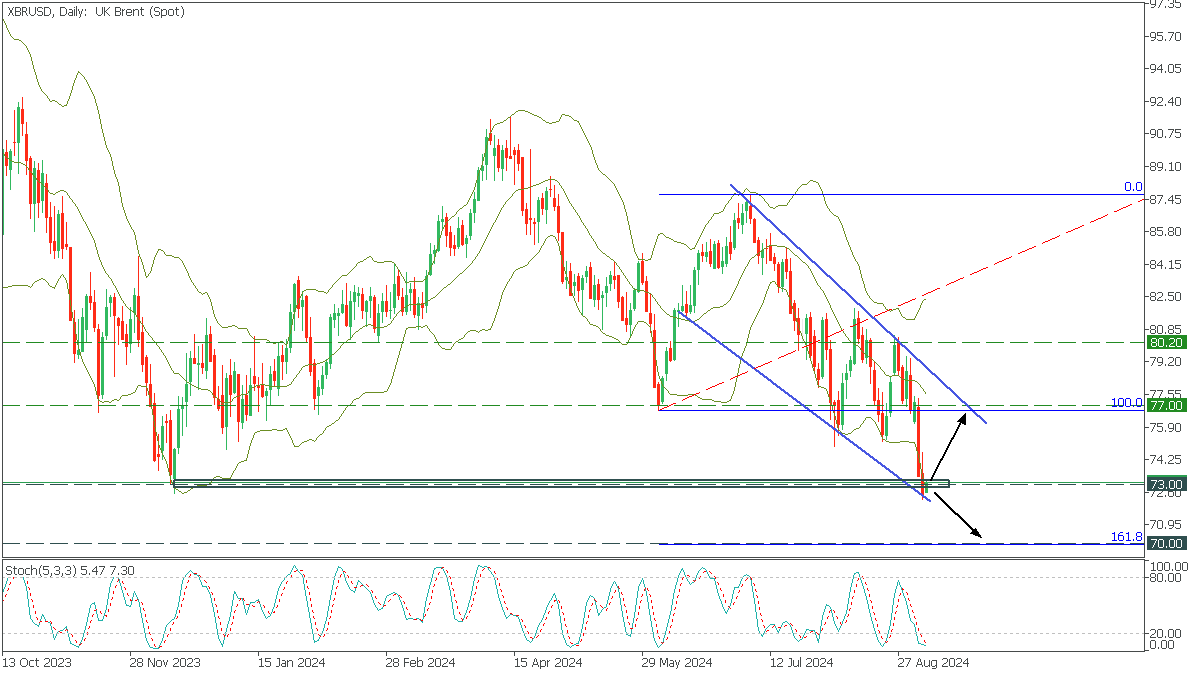
In the Daily timeframe, XBRUSD has formed a descending channel pattern in a long-term downtrend. The price fell to the lower trend line, testing the lower Bollinger line. At the same time, the Stochastic indicates oversold, although the bearish bias remains large.
- If the price falls below the critical support at 73.00, the target will be 70.00, corresponding to 161.8 Fibonacci;
- A bounce from the lower trendline would bring Brent back to the upper trendline to 77.00
