Open account
Open accountLog In
Open account

June 06, 2024

Trade ideas

XBRUSD: DeMarker Strategy

XBRUSD, H4

XBRUSDH4.png

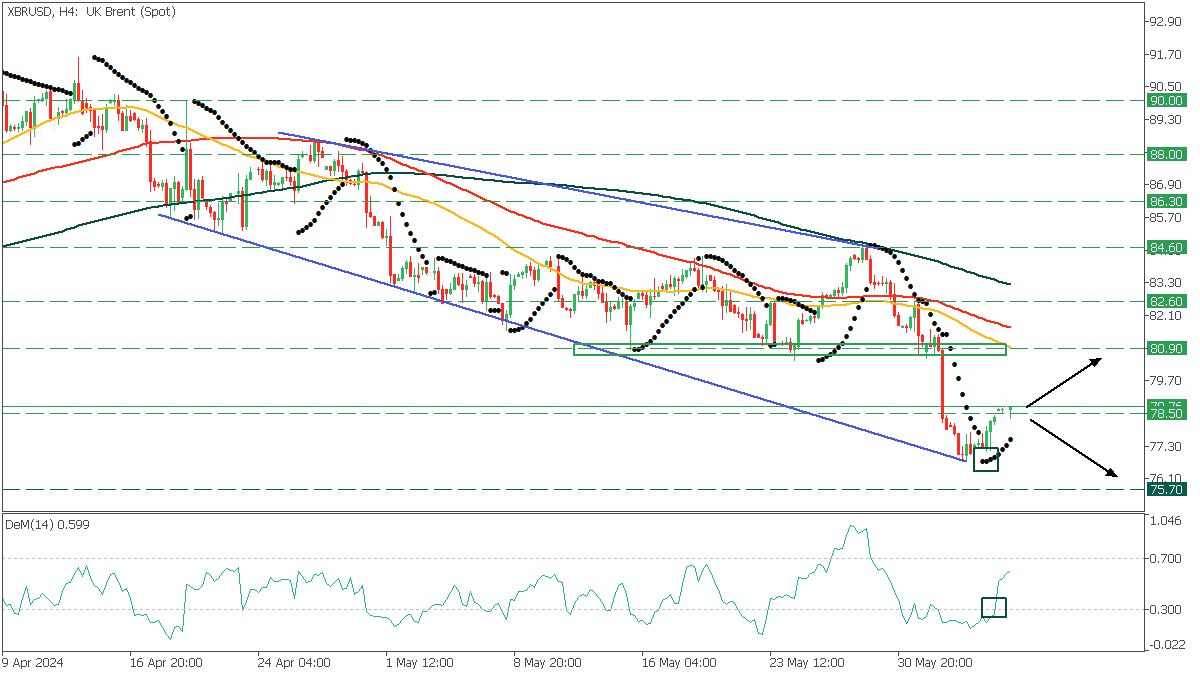
In the H4 time frame, the XBRUSD moves within an expanding wedge and faces a 78.50 resistance. The DeMarker oscillator crosses the 0.30 level from above, and Parabolic SAR points dots below the price, signaling potential bullish momentum for the asset.

  • If the price breaches above the 78.50 level, it will likely rise to the 80.90 resistance.
  • However, if the XBRUSD fails to retest the resistance, it may trigger a decline to 75.70.

Conclusion

In conclusion, trading CFDs carries inherent risks. Success in this field demands effective risk management. To minimize costly errors and capitalize on trading opportunities, it's crucial to conduct thorough due diligence and manage risks diligently.

TRY TRADING NOW

Share with friends:
Timur Yurdagyul

Author: Timur Yurdagyul

Open an FBS account

By registering, you accept FBS Customer Agreement conditions and FBS Privacy Policy and assume all risks inherent with trading operations on the world financial markets.

FBS at social media

iconhover iconiconhover iconiconhover iconiconhover icon

Contact us

iconhover iconiconhover iconiconhover iconiconhover icon
store iconstore icon
Get on the
Google Play
store iconstore icon
Get MT4 on the
App Store
store iconstore icon
Get MT5 on the
App Store

Trading

Company

About FBS

Our social impact

Legal documents

Company news

FC Leicester City

Help Center