XNGUSD, H2
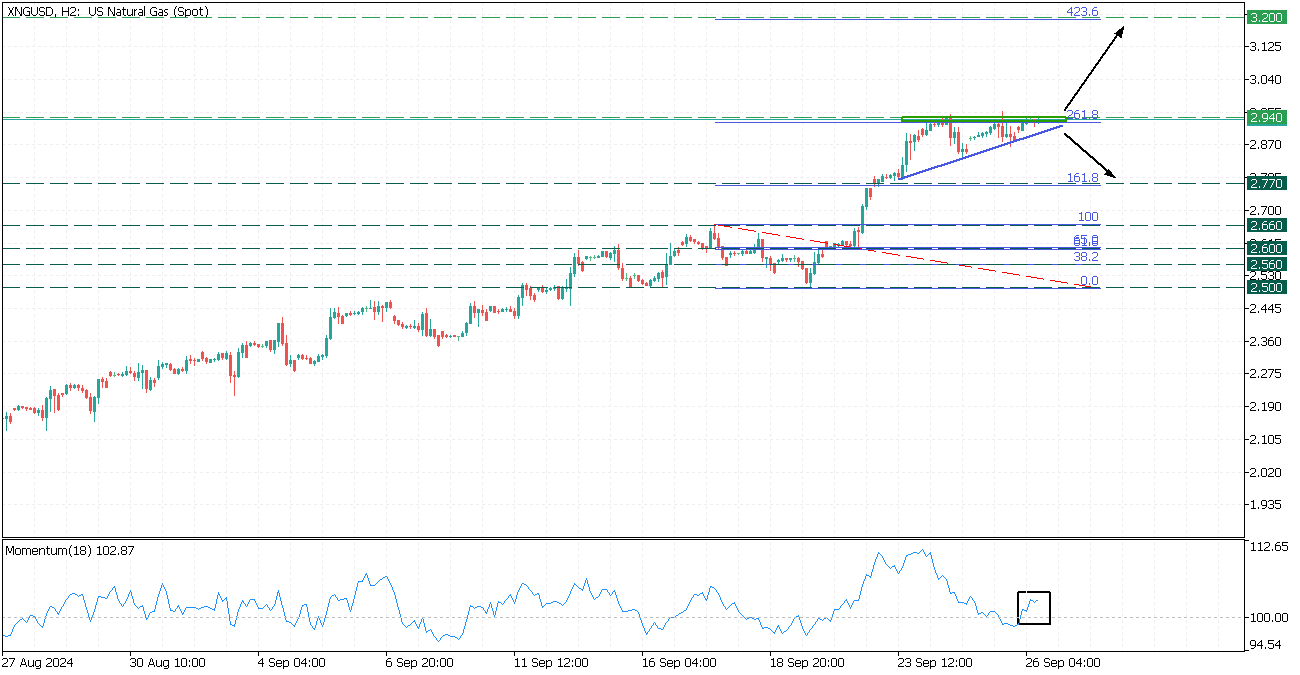
On the H2 timeframe, the XNGUSD pair navigates within an ascending triangle and faces the crucial resistance zone at 2.940, aligned with the 261.8 Fibonacci, and the upper border of the pattern.
The Momentum oscillator crosses the 100-line, potentially indicating a bearish sentiment for natural gas.
- If the XNGUSD breaks above the 2.940 resistance it will continue the bullish trend to the 3.200 and the 423.6 Fibonacci;
- However, a breaching below the trendline will drop the price to 2.770 and the 161.8 Fibonacci.